Figure 9.

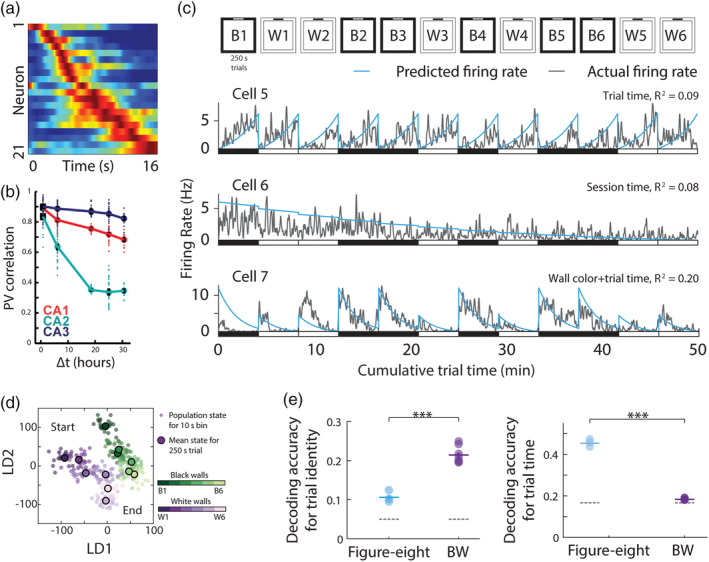
Time codes in hippocampus and entorhinal cortex. (a) Time cells in hippocampus tile a time interval within an episode when a rat runs on a treadmill. Each row represents the normalized firing rate of one neuron (blue, no firing; red, peak firing of that neuron) and the neurons are sorted by their peak firing time. Adapted from Kraus, Robinson, White, Eichenbaum, and Hasselmo (2013). (b) Stability of location specific activity of place cells in CA1 (red), CA2 (green), and CA3 (blue) was measured as population vector correlations between pairs of recordings. The black error bars report the mean ± SEM for pair‐wise comparisons at each time interval. Over time the population activity of CA2 (green) and CA1 neurons (red) decrease as a function of elapsed time between recording sessions. Adapted from Mankin, Diehl, Sparks, Leutgeb, and Leutgeb (2015). (c) Temporal codes in lateral entorhinal cortex. Top: experimental design; Animals ran 12 times 250 s trials in boxes with either black or white walls. Bottom: example general linear model fits for cells with selectivity for trial time (Cells 5 and 7) or session time (Cell 6), with the observed firing rate shown in grey, and predicted firing rate in blue, suggesting that the passage of time is encoded in firing rates of individual cells. (d) Two‐dimensional projections of neural population responses during the experiment depicted in “a”. Axes correspond to the first two linear discriminants (LD1 and LD2; arbitrary units). The wall color of each trial is indicated by a shade of green (black walls) or purple (white walls) with progression of shade from dark to light indicating the progression of trials. Population responses showed a progression corresponding to the temporal order of the experiment. (e) Left: comparison of decoding accuracy for trial identity when the rat is either engaged in alternating left/right laps on a figure eight maze or during the 12 black/white trials‐experiment (BW) depicted in “c”. Decoding accuracy for trial identity is higher during free foraging in BW than in the figure eight maze (p < .0001). Right: same as left, but for time epochs within a trial. Decoding of trial time is higher in the figure eight maze than in BW (p < 10−10). Grey‐dotted lines indicate chance levels. c–e adapted from (Tsao et al., 2018) [Color figure can be viewed at wileyonlinelibrary.com]
