
Figure 10.
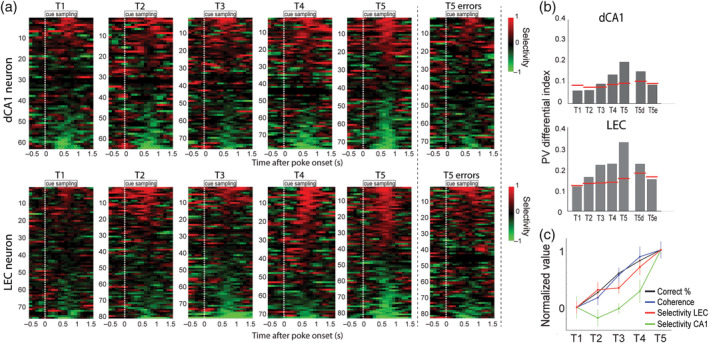
Olfactory coding in lateral entorhinal cortex (LEC) and hippocampus. Adapted from Igarashi et al. (2014). (a) Rats were trained to associate two odors with two different reward locations. Responses are shown for cells with significant activity at the cue port during training of naïve animals (T1) until reaching asymptotic performance (85% correct, T5). Right column contains error trials during T5. Each row shows data for one cell around the time of odor sampling (starting from white dashed line). Top: distal CA1 cells; bottom: LEC cells. Selectivity is color coded (−1 and + 1 indicate complete selectivity for banana [red] and chocolate [green], respectively). (b) Population odor selectivity was measured by correlating population activity obtained during sampling of the two different odors. Higher values indicate more odor‐selective population coding. Red lines indicate 95th percentiles from shuffled distributions. Odor selectivity develops in both LEC and hippocampus in parallel to improved performance. Odor selectivity decreases during error trials (T5e) compared to during a similar number of correct trials (T5d). (c) Development of task performance, gamma coherence and selectivity in CA1 and LEC. Variables are normalized onto a scale from 0 (T1) to 1 (T5) (mean ± SEM). Odor selectivity increases faster in LEC compared to CA1 [Color figure can be viewed at wileyonlinelibrary.com]