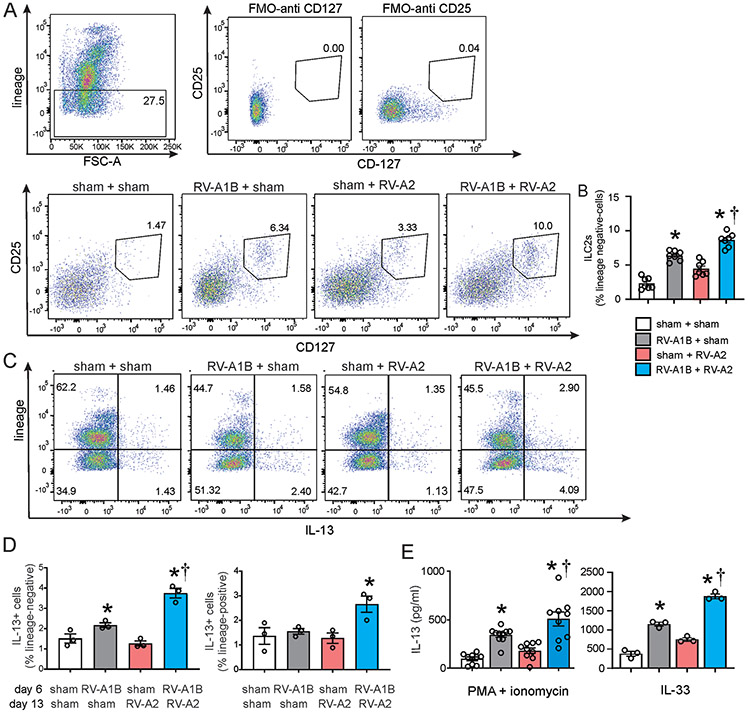
Figure 3. RV infection induces ILC2 expansion.
A) Figure showing flow cytometry analysis of live lineage-negative, CD25+ CD127+ ILC2s. B) Graph showing group mean data for ILC2s. Data shown are mean ± SEM; n=7 per group from three different experiments; *different from sham + sham, †different from RV-A1B + sham, P < 0.05 by one-way ANOVA and Tukey multiple comparison test. C) Flow cytometry analysis of lineage markers and IL-13 in sham, RV-A1B, RV-A2 and RV-A1B + RV-A2 groups. D) Lineage-negative, IL-13+ cells (left panel) and lineage-positive, IL-13+ cells (right panel) for the four groups. Data are mean ± SEM; n=3 per group from one experiment; *different from sham + sham, †different from RV-A1B + sham, P < 0.05 by one-way ANOVA and Tukey multiple comparison test. E) IL-13 production from sorted lineage-negative, CD25+, CD127+ ILC2s. ILC2s were stimulated with either PMA and ionomycin (left panel) or IL-33 (right panel). Data shown are mean ± SEM; n = 9-10 per group from three experiments for PMA and ionomycin stimulation; n=3 per group from one experiment for IL-33 stimulation; *different from sham + sham, †different from RV-A1B + sham, P < 0.05 by one-way ANOVA and Tukey multiple comparison test

