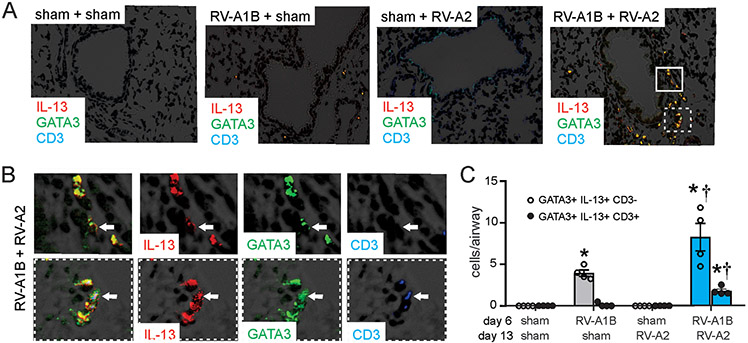
Figure 4. Airway immunofluorescence staining for IL-13, GATA3 and CD3.
Baby mice were inoculated with sham or RV-A1B on day 6 of life and sham or RV-A2 on day 13 of life. On day 20, lungs were harvested and fixed with paraformaldehyde. A) Lung sections were stained with anti-IL-13 (shown in red) anti-GATA3 (green), anti-CD3 (blue) and DAPI (black). Areas of IL-13 and GATA3 colocalization appear yellow; areas of GATA3 and CD3 colocalization appear cyan (if IL-13-negative) or white (if IL-13-positive). The white bar is 50 μ. B) Color breakdown of areas outlined in panel A. Solid box outlines IL-13+ GATA3+ CD3-negative cells; dashed box outlines IL-13+ GATA3+ CD3+ cells. The white bar is 10 μ. C) Group mean data showing IL-13+ GATA3+ CD3-negative (open bars) and CD3+ (shaded bars). Each point represents the average of four airways from one mouse. Data shown are mean ± SEM; *different from sham + sham, †different from RV-A1B + sham, P < 0.05 by one-way ANOVA and Tukey multiple comparison test.

