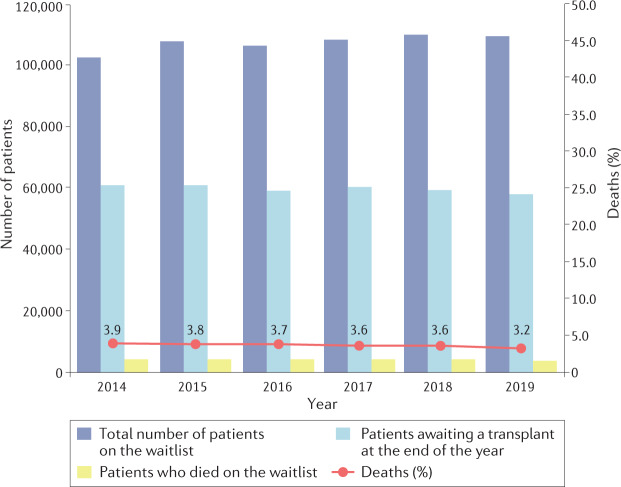
Fig. 5. Number of waitlisted patients and patients dying on the waiting list in the EU from 2014 to 2019.
The percentage of deaths (red line) is calculated as the ratio of those who died that year while waitlisted to the total number active on the waiting list that year multiplied by 100. There was a 7% increase in the number waitlisted over this 5-year period. The percentage of deaths remained relatively stable between 3–4%. Data were calculated based on data from the Transplant Newsletter135.

