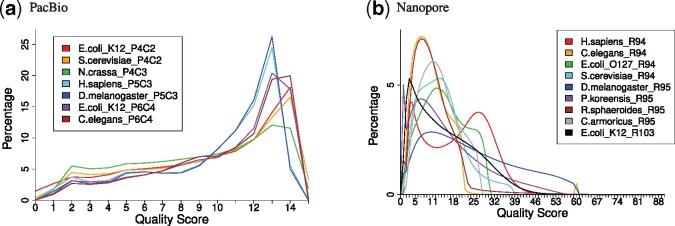
Fig. 2.
Quality score distributions of real reads. The frequency of quality scores was counted for each of the datasets in Supplementary Tables S2 and S3. Colors of plotted lines represent datasets. Dataset name is species (e.g. E.coli_K12) + chemistry (e.g. P4C2). The horizontal axis is PHRED33 quality score defined in terms of the estimated error probability (e.g. quality scores 4, 7 and 10 represent error probabilities of 40%, 20% and 10%, respectively; Cock et al., 2010)

