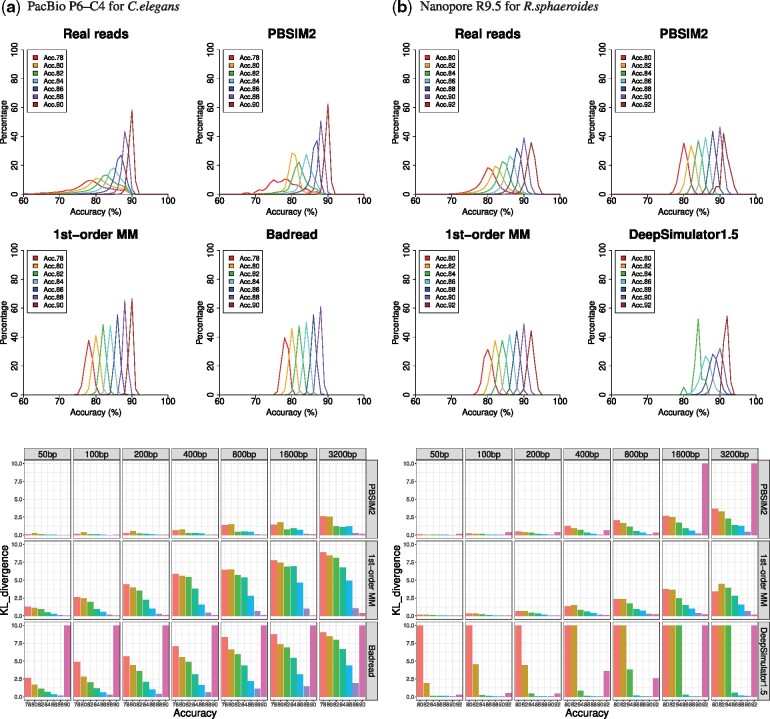
Fig. 3.
Simulation of non-uniformity of quality scores and evaluation by KL divergence. Each graph shows distributions of accuracy of 800 bp disjoint intervals in reads in the same way as Figure 1. Read groups (e.g. Acc.78) with insufficient data are not shown in the graphs. PBSIM2, the new version of PBSIM, generated reads using model-based simulation. ‘1st-order MM’, our in-house software tool, generated quality scores for each read group, by a 1st-order MM of transition probabilities of the quality score of real reads. Badread built a model and generated reads. DeepSimulator1.5 generated Nanopore fast5 using context-independent kmer pore model and basecalled using Guppy. KL divergence of distribution of accuracy of fixed size (50, 100, 200, 400, 800, 1600 and 3200 bp) intervals between real and simulated reads. Upper-limit value of KL divergence was 10

