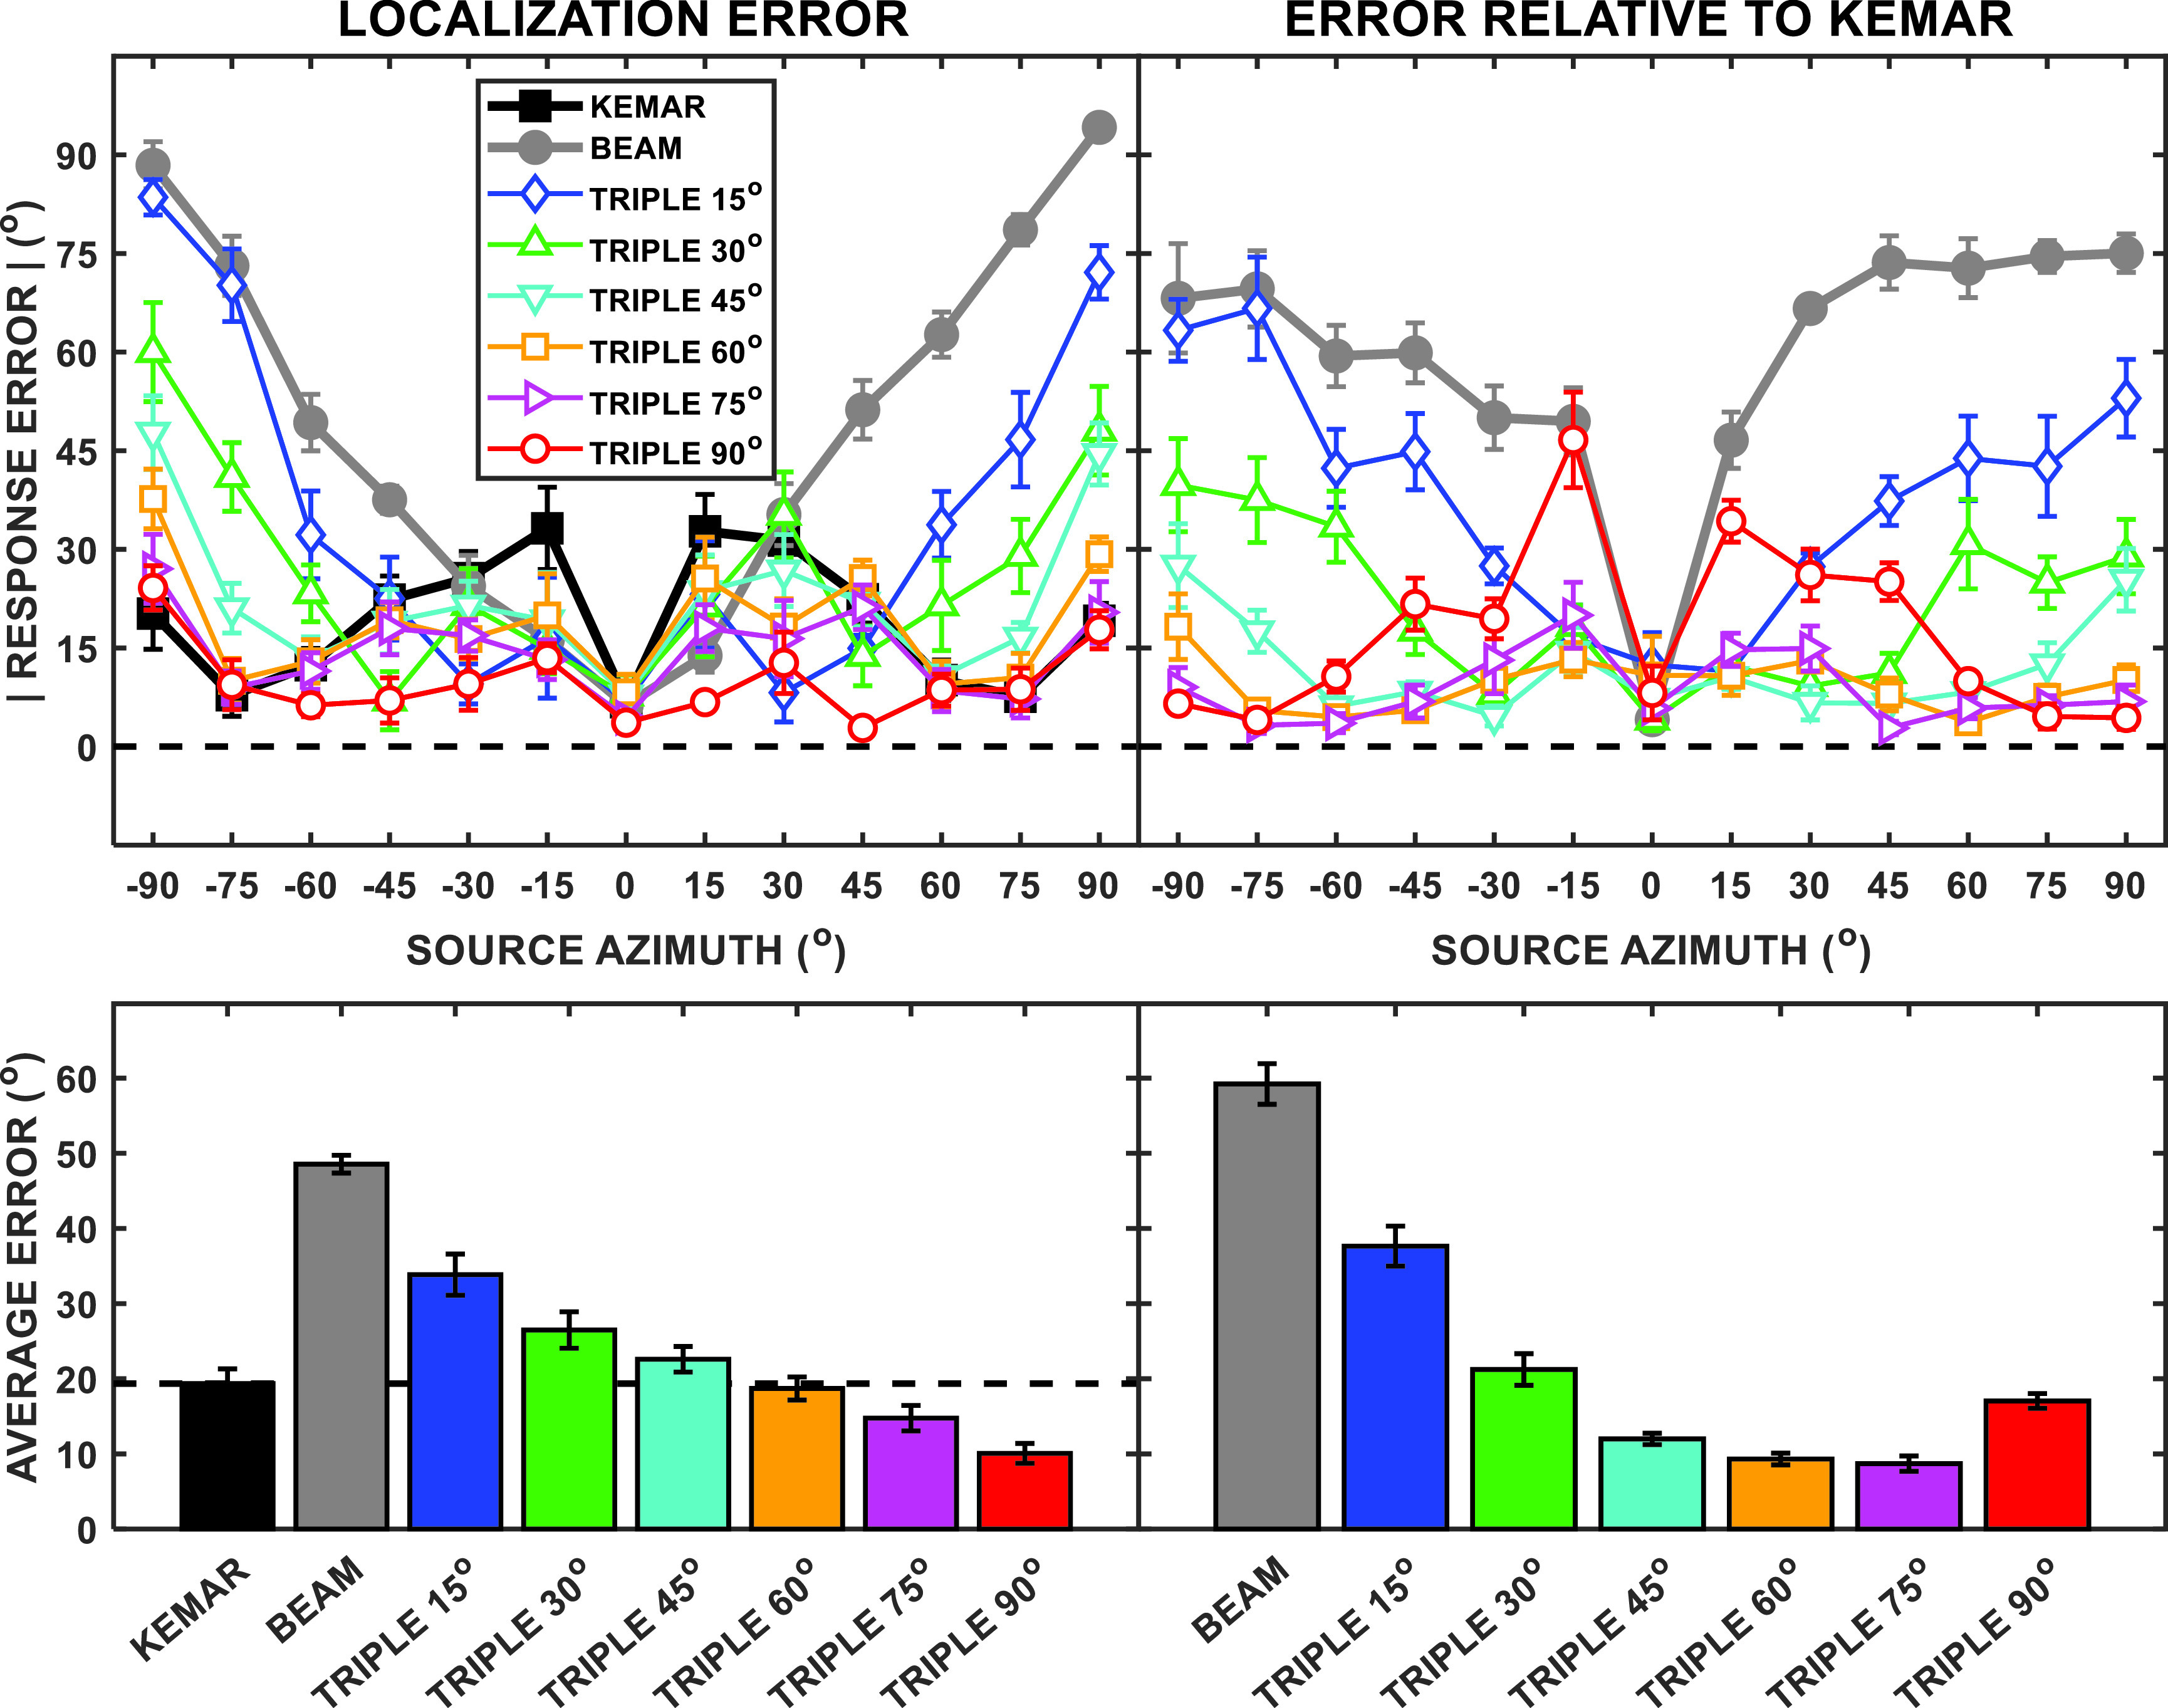
FIG. 7.

(Color online) Group mean localization error plotted in four ways. In the upper left panel, the absolute value of the group mean error in degrees is plotted for each microphone condition (parameter of graph) as a function of the source azimuth. In the upper right panel, the same data are replotted with the error computed in reference to the KEMAR location judgments. In the lower left panel, the group mean average localization error is plotted as bars for each microphone condition averaged across all source angles. In the lower right panel, a similar bar graph of the group mean error is shown referenced to the judged location in the KEMAR microphone condition.
