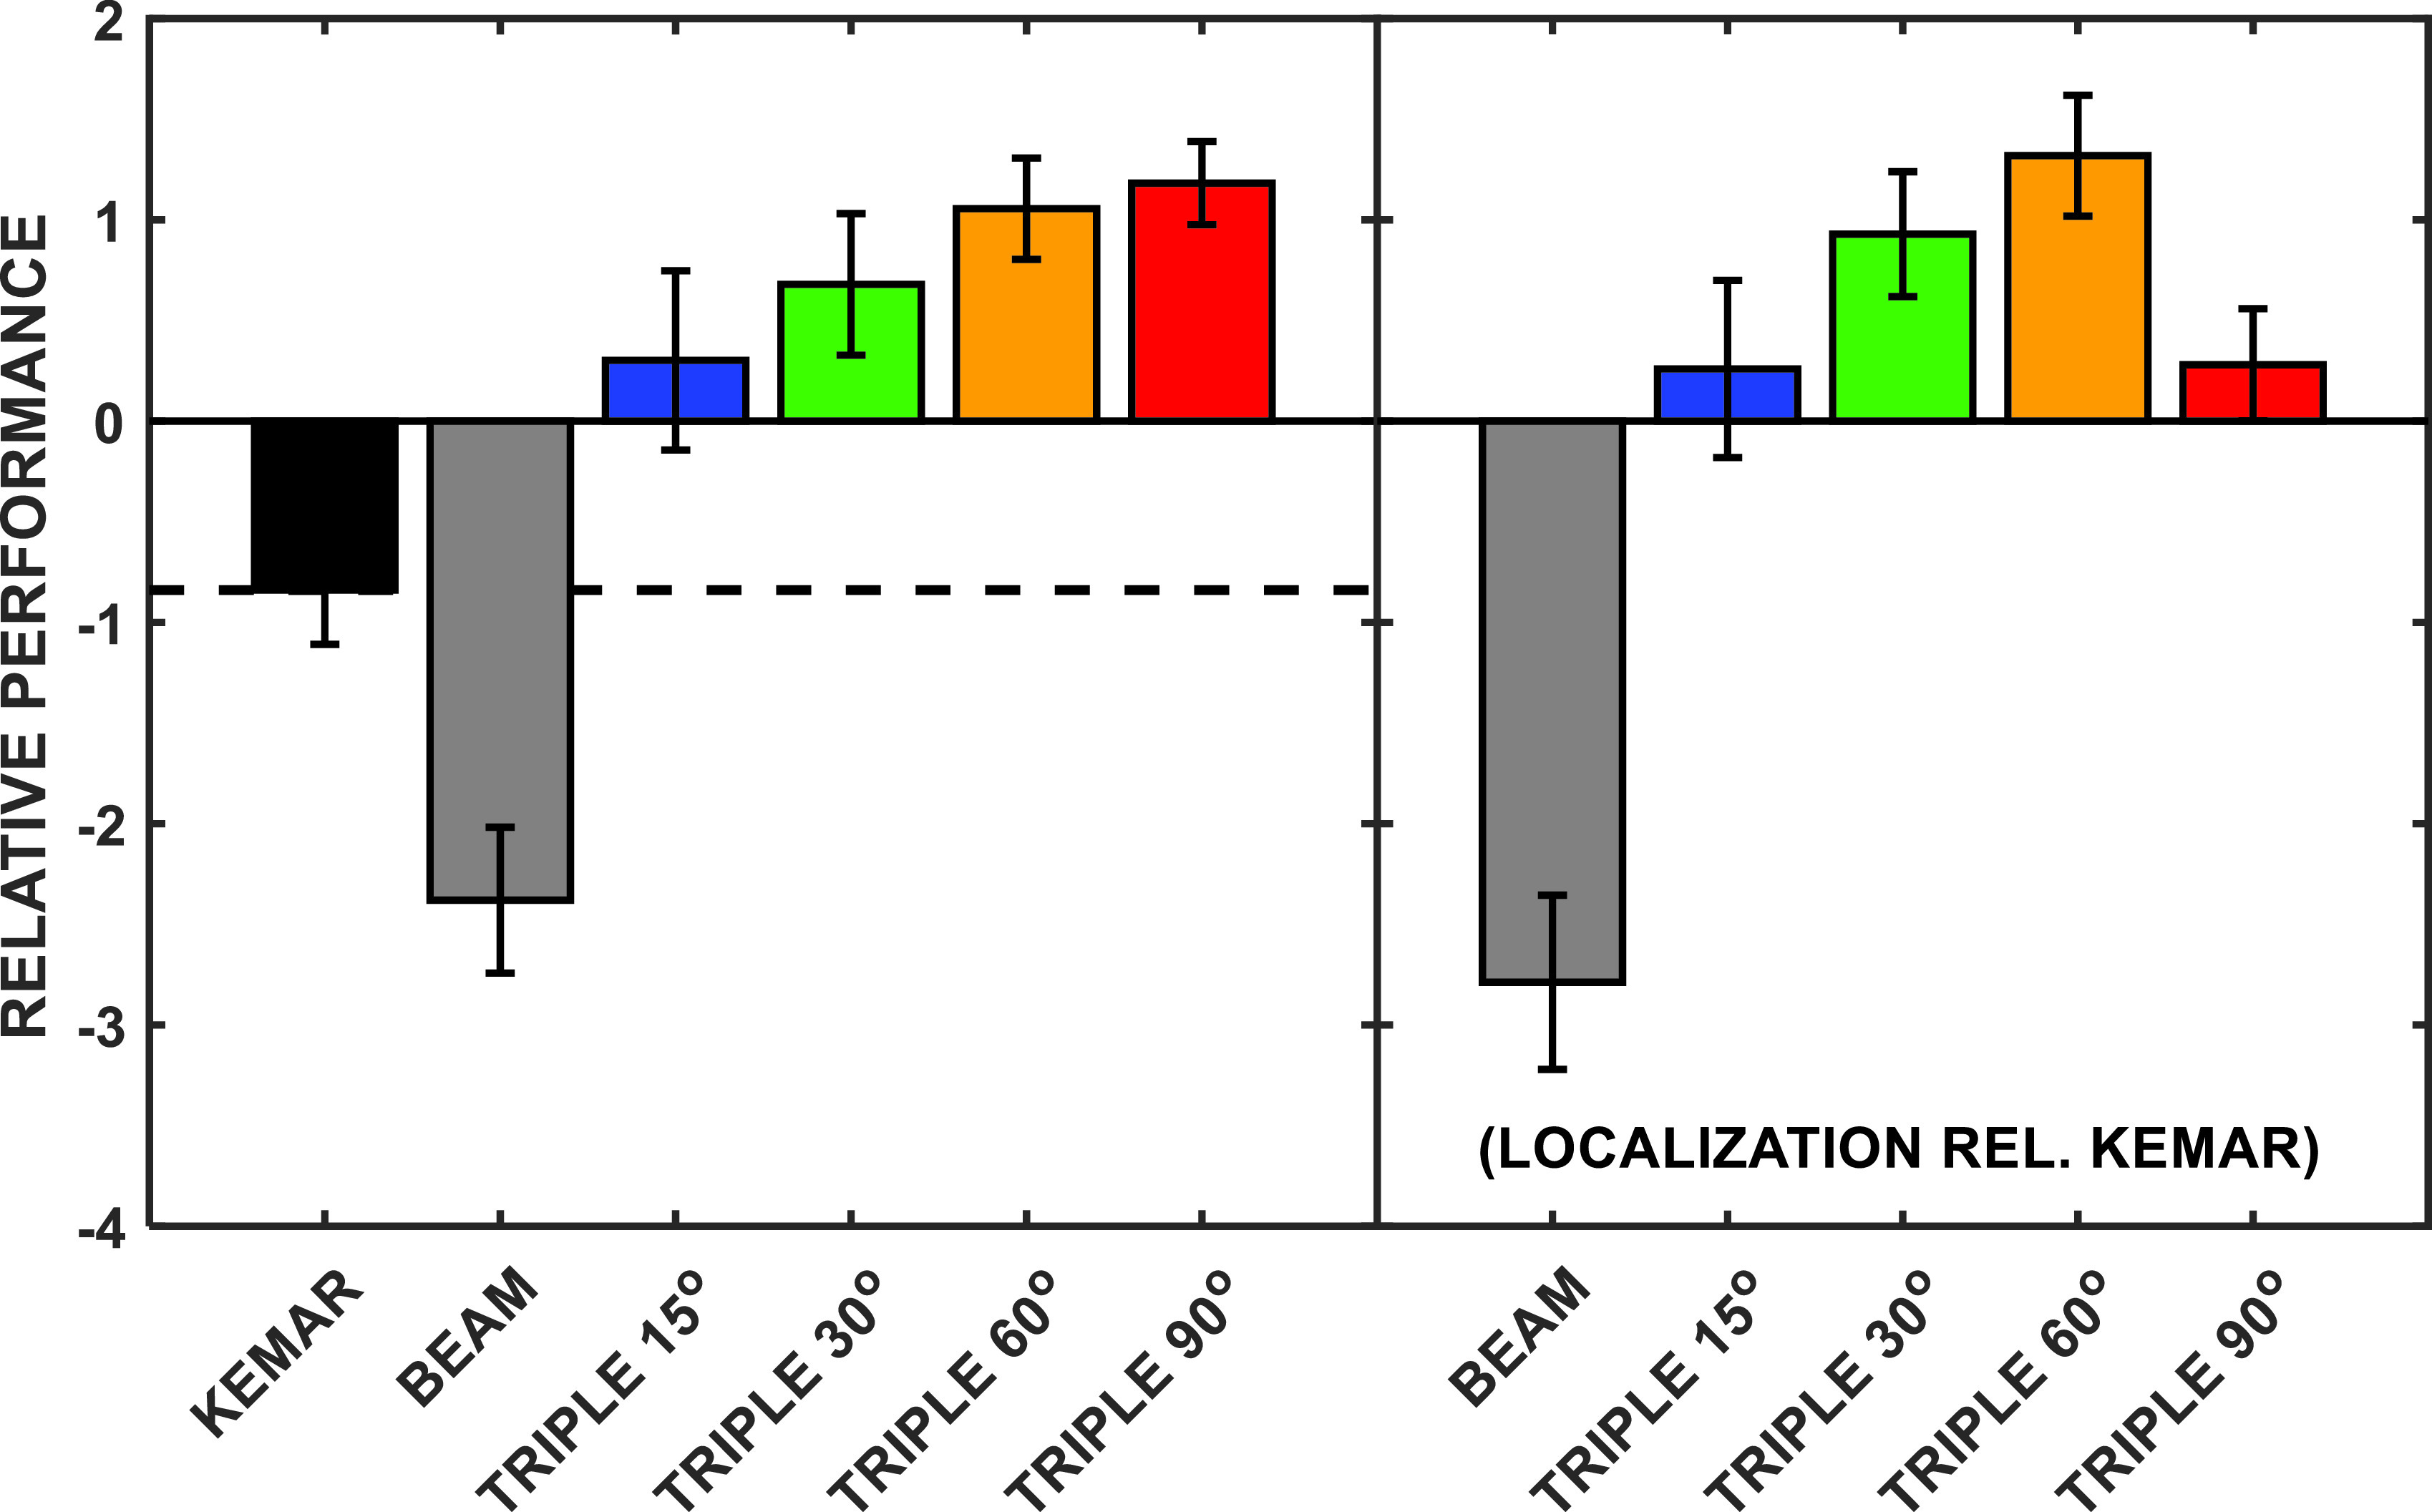
FIG. 9.

(Color online) A plot of the joint performance based on the localization error and SOS masked thresholds. The abscissa shows the different microphone conditions while the ordinate is the summed z-scores for the two tasks. In the left panel, the mean error computation references the intended source location while in the right panel, the error is computed with respect to the group mean KEMAR judgments.
