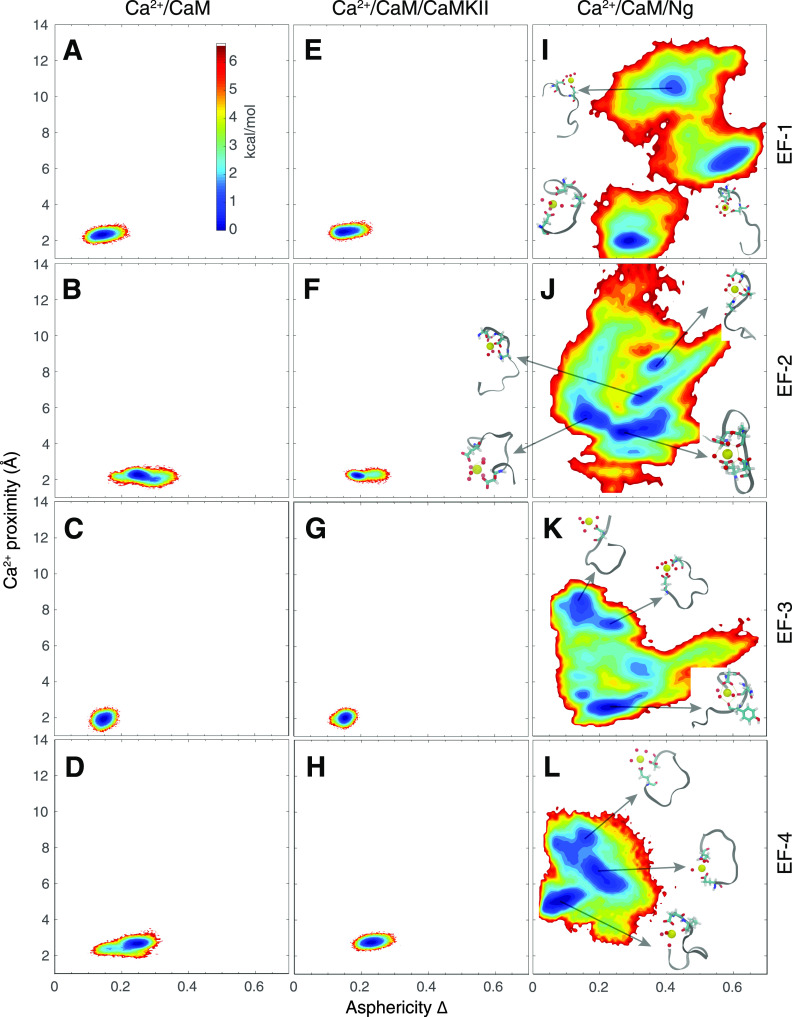
FIG. 8.
The potential of the mean force (PMF) as a function of the asphericity (Δ) of the loop and the distance between Ca2+ and the center of mass of the loop. The PMFs are plotted for four individual EF-hand loops from three types of sample systems: (a)–(d) Ca2+/CaM, (e)–(h) Ca2+/CaM/CaMKII, and (i)–(l) Ca2+/CaM/Ng. The color bar is scaled by kcal/mol, and the lowest PMF value is set to 0 kcal/mol.

