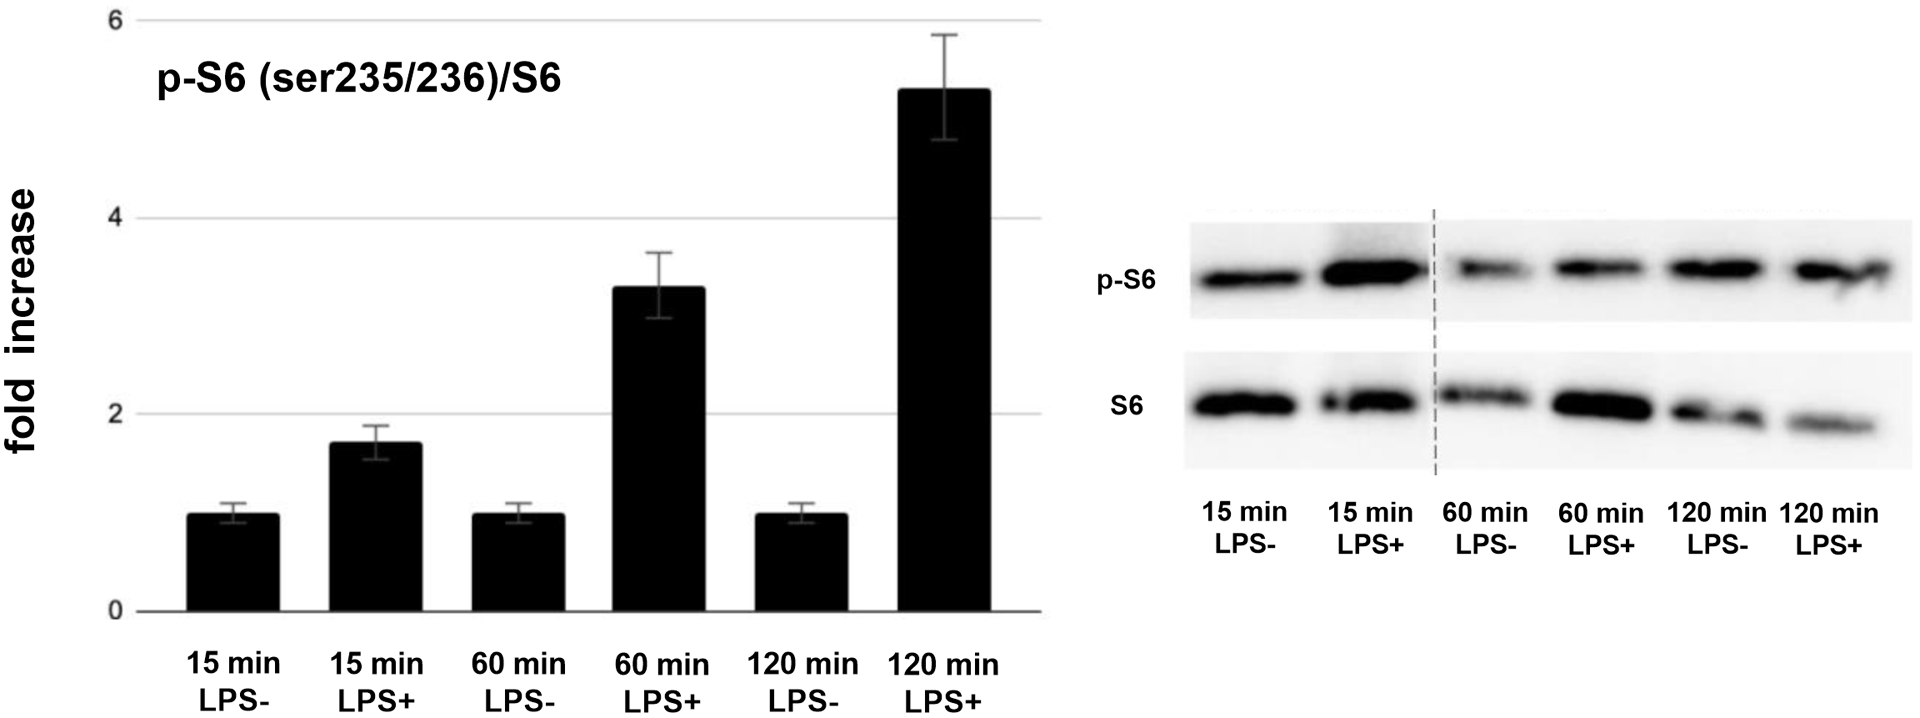
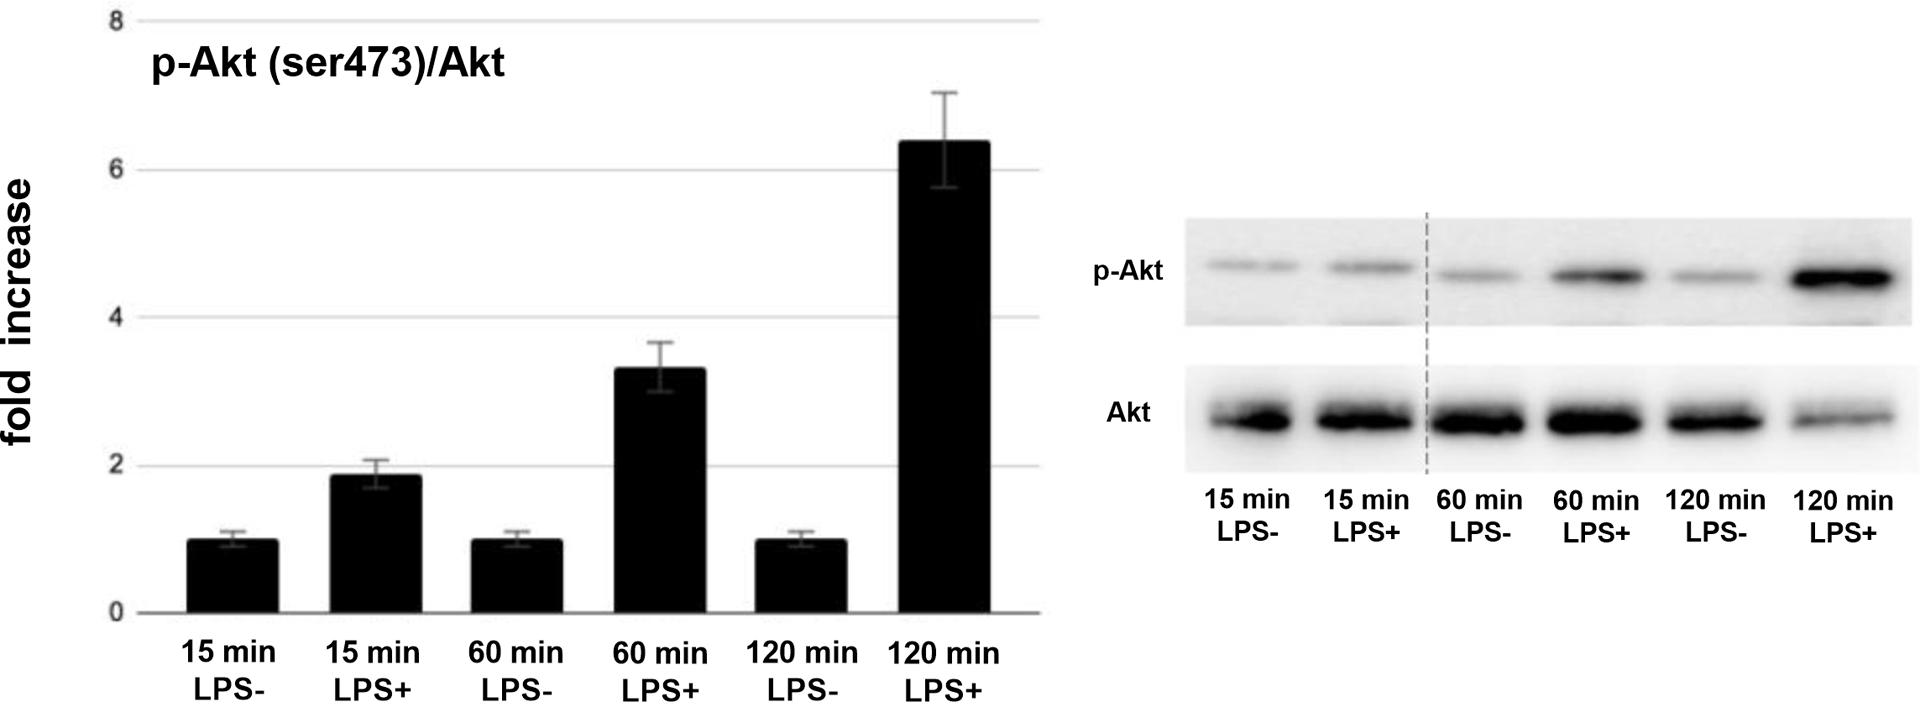
FIGURE 2.


A, Quantification of phospho-S6 (p-S6) versus total S6 (S6) protein expression in PANC-1 cells treated with LPS for various time periods (fold increase over vehicle control; left panel) and representative western blot image (right panel). B, Quantification of phospho-Akt (p-Akt) versus total Akt (Akt) protein expression in PANC-1 cells treated with LPS for various time periods (fold increase over vehicle control; left panel) and representative western blot image (right panel).
