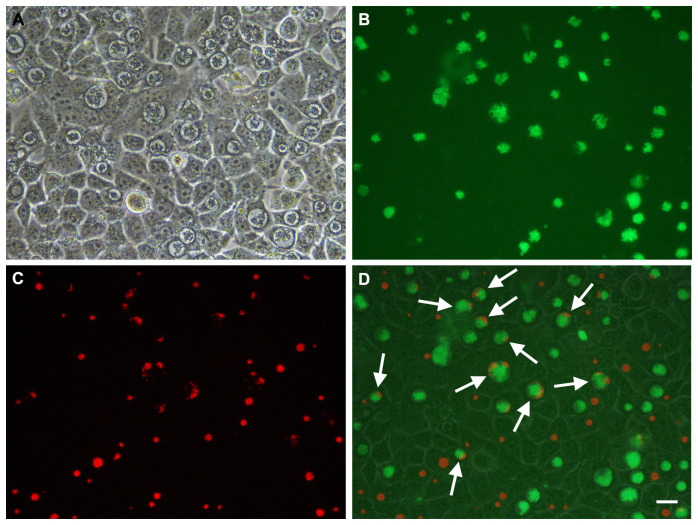
Figure 9. Mixed infection of McCoy cells infected with C. trachomatis L2P- transformed with pSW2-RSGFP-Tpon vector and C. trachomatis L2P- transformed with pSW2-mCh-C9-ΔTpon vector, grown with no selection.
This figure shows an example of the same microscopic field observed under phase contrast (Panel A), UV light (green filter) (Panel B) and UV light (red filter) (Panel C). Panel D is a merged image of the phase, green (L2P- transformed with pSW2-RSGFP-Tpon) and red (L2P- transformed with pSW2-mCh-C9-ΔTpon). White arrows highlight inclusions showing both green and red fluorescence. Scale bar represents 20μm.

