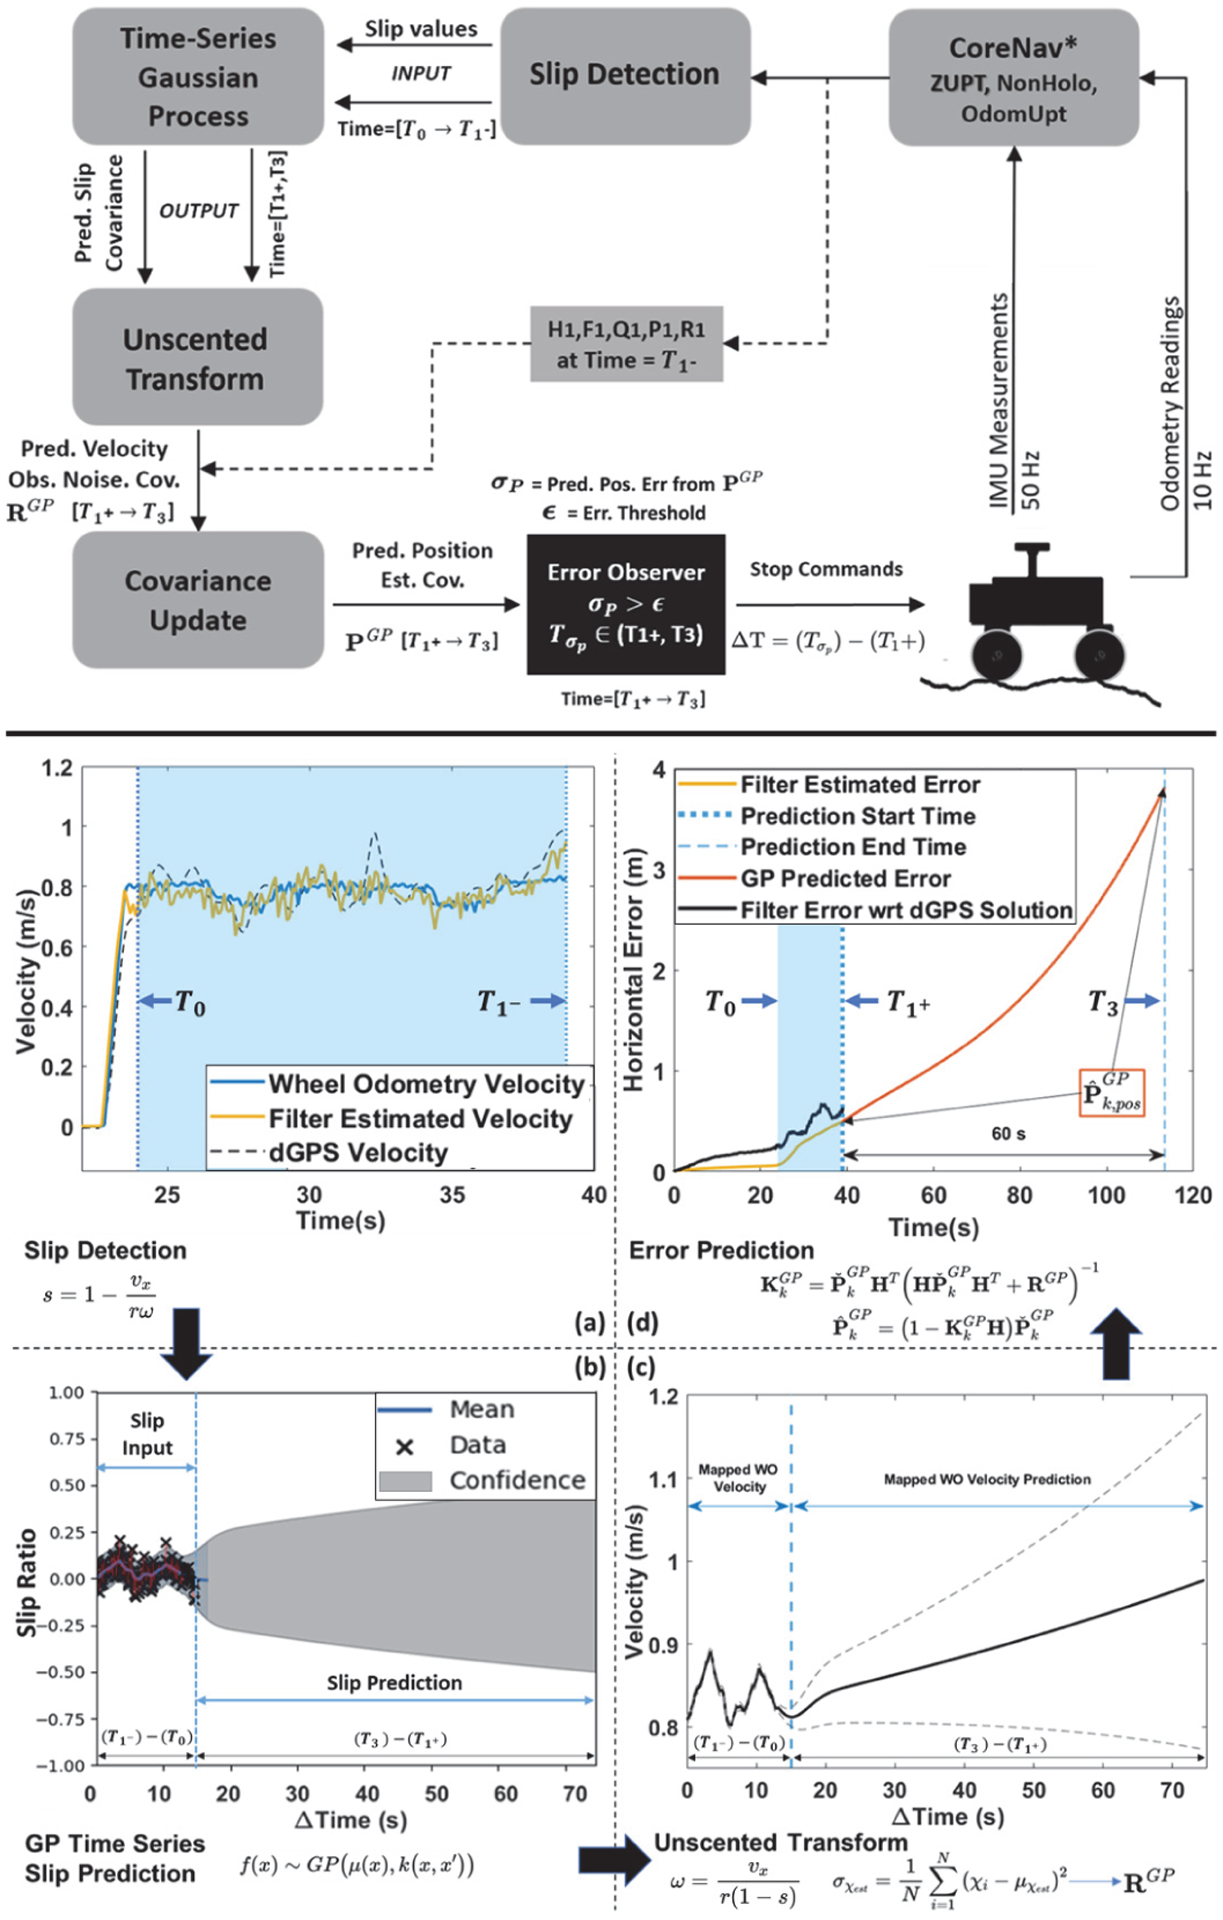
Fig. 1.

The proposed framework is demonstrated on the top figure. Each elements of the framework are shown on the bottom sub-figures. The sub-figure (a) shows the filter estimated and WO estimated velocity to be used for slip detection. The sub-figure (b) shows the slip input and slip prediction. The sub-figure (c) is a depiction of unscented transform that used for mapping the WO velocities for error prediction. Finally, the sub-figure (d) shows how the predicted error is generated. The input slip data is collected within a time window () which represented in the blue area in (a). The dotted blue line () in sub-figure (d) represents the time when the future error prediction is generated for 60s. The post processed DGPS outputs are assumed as truth and given for comparison purposes.
