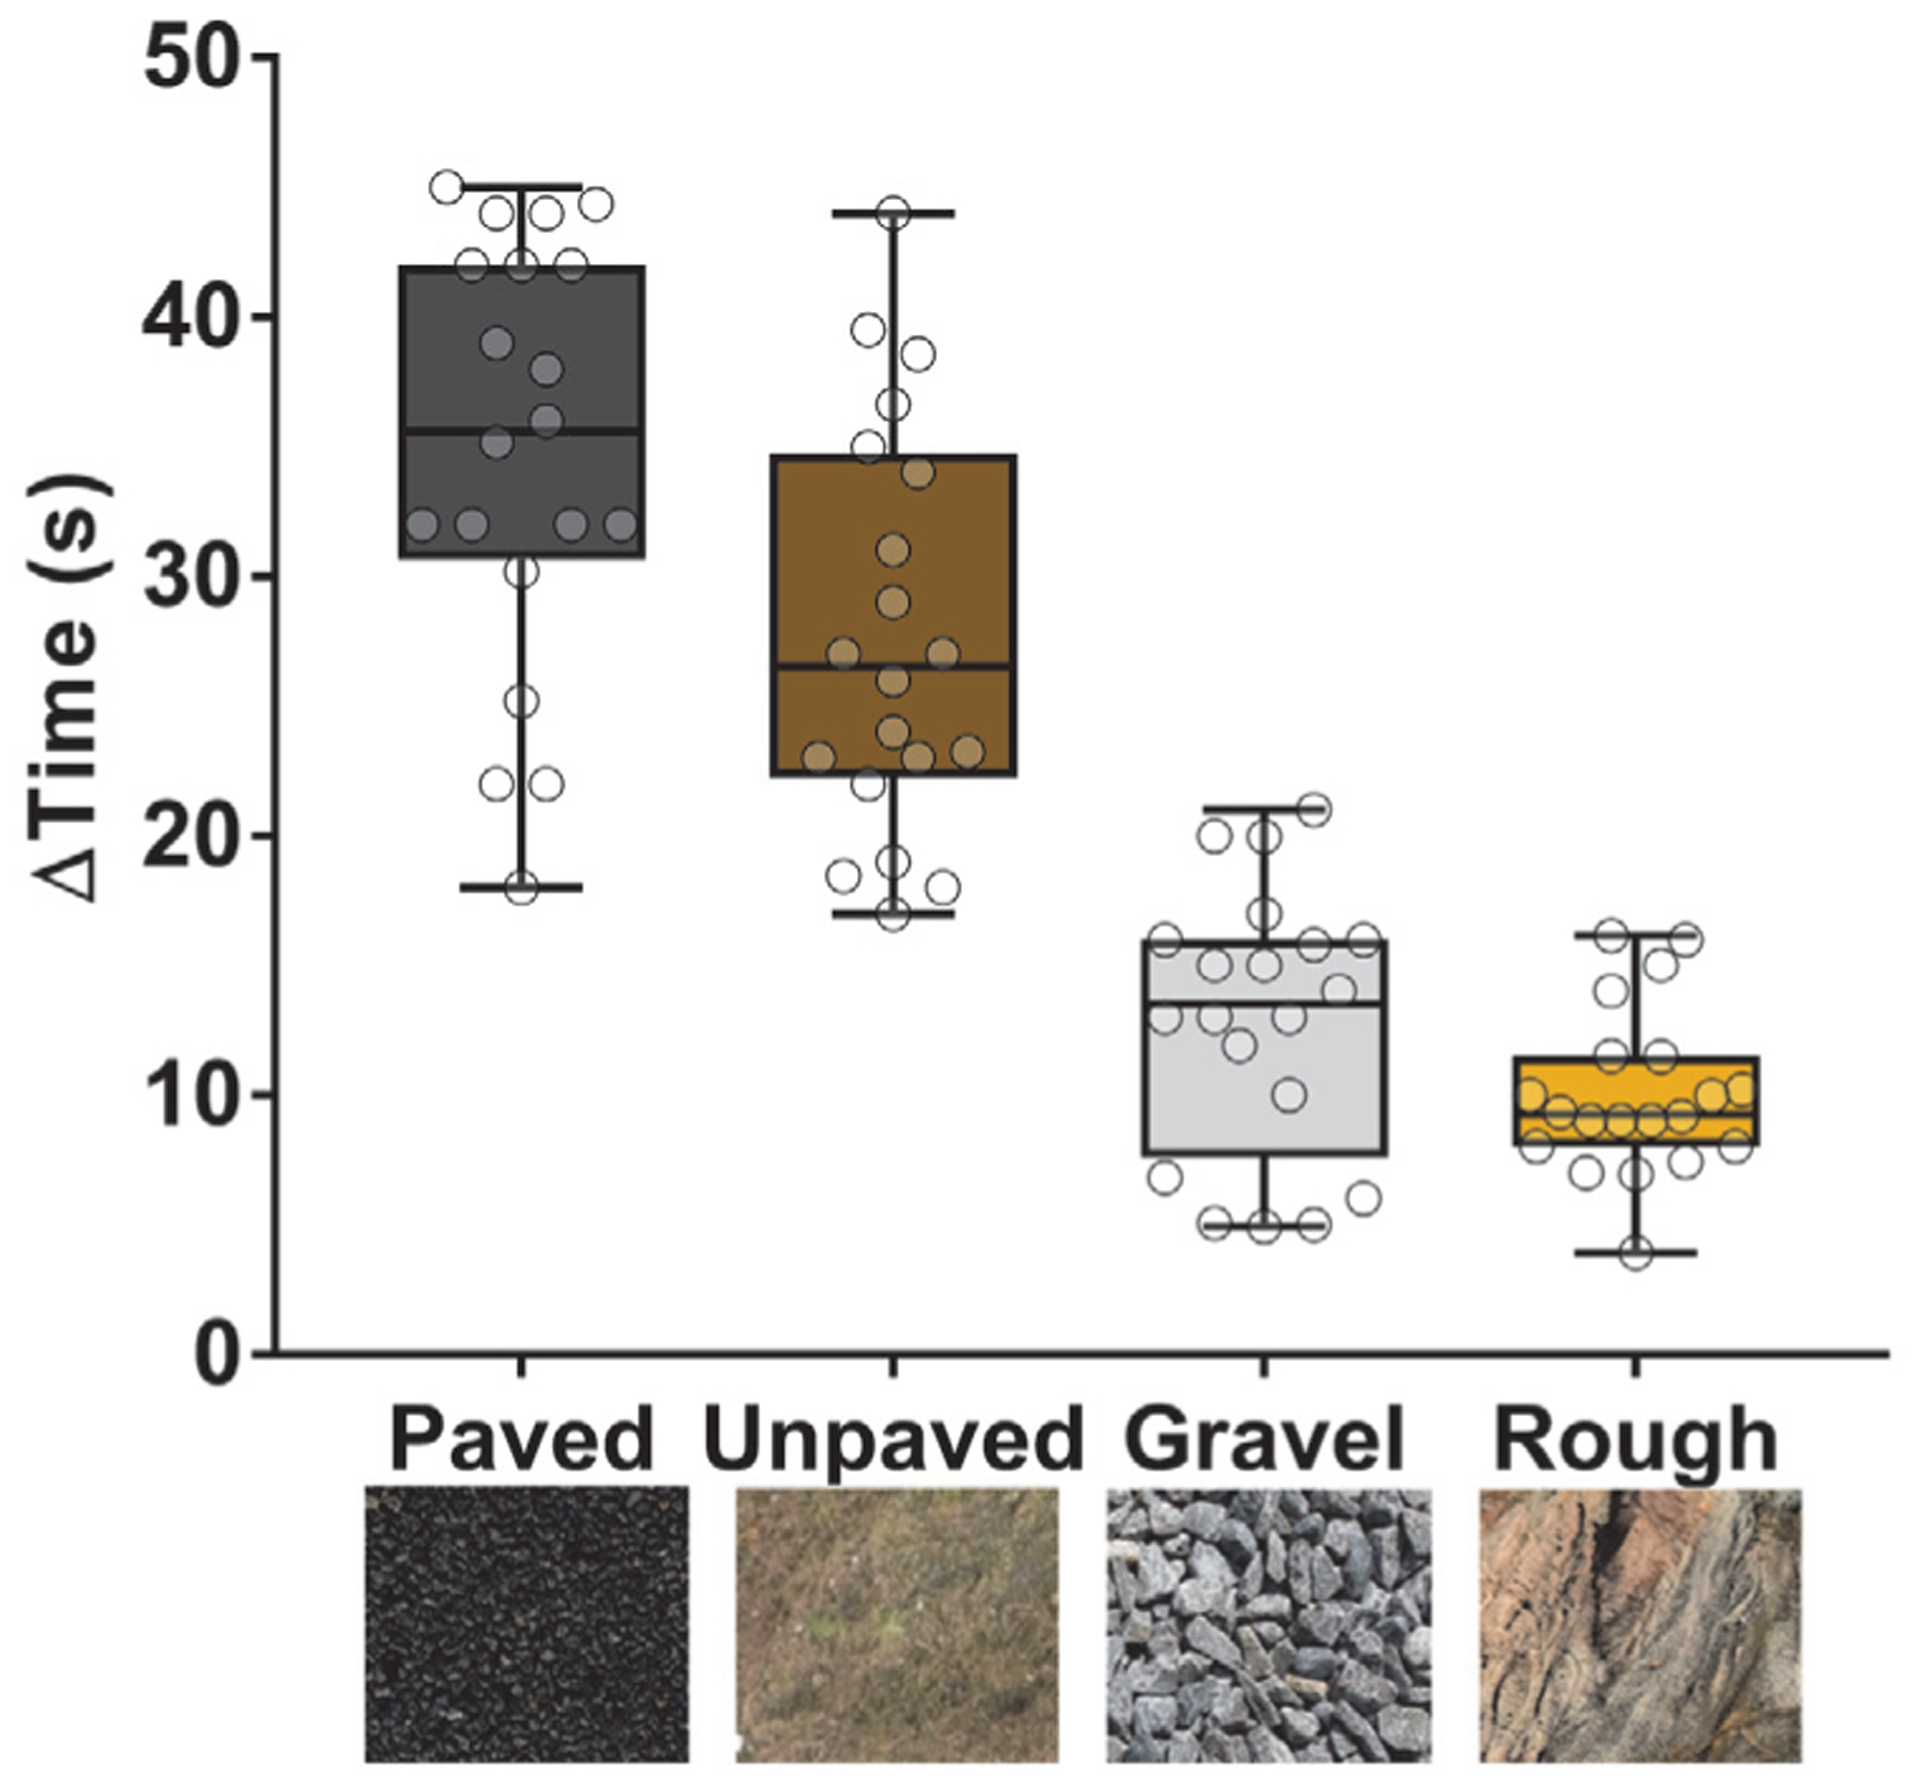
Fig. 4.

Comparison of stop time interval for terrain types. ΔTime axis in box plot shows the remaining duration to stop after 15s of data collection. The middle line in the boxes show the median value of 20 tests for each terrain type. GraphPad Prism software v.7 is used for one-way analysis of variance Tukey’s multiple comparison statistical analysis test. Paved: P, Unpaved: U, Gravel: G Rough: R. Non-significant difference: G/R (p=0.5028). Significant difference: P/U (p=0.0049), R/P, R/U, G/P, and G/U (p<0.0001).
