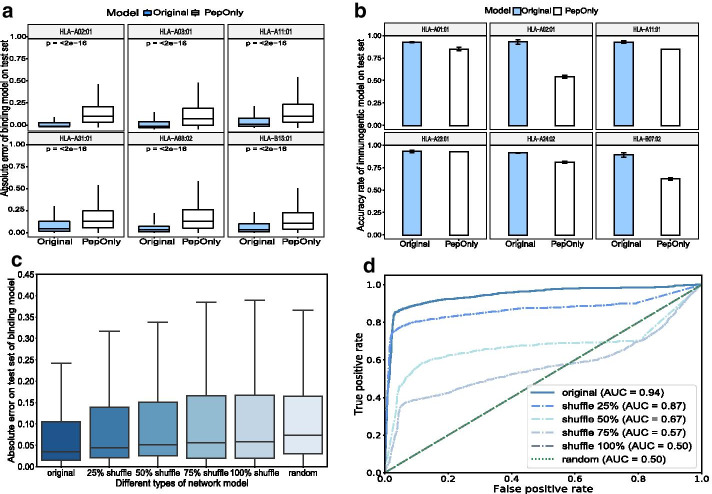
Fig. 2.
Improved performance of integrating network metrics in DeepNetBim. a Absolute error for binding affinity prediction and b accuracy rate for immunogenic prediction of the original model (coloured in blue) and the PepOnly model (coloured in white) for the 6 most frequent alleles in the test dataset. c Absolute error for binding affinity prediction and d ROC curve for immunogenic prediction of the original network, shuffle networks (shuffled network edge weights) and random network (reassigned network weights by uniform distribution) in the test dataset

