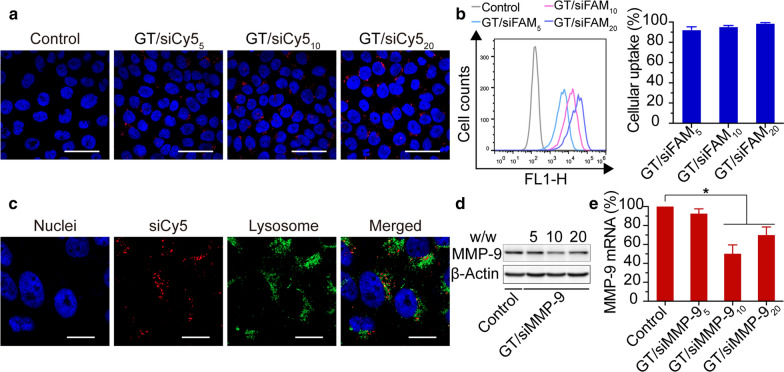
Fig. 3.
In vitro transfection efficiency and gene knockdown of GT/siRNA5/10/20. a Images by confocal microscopy of HaCaT cells treated by GT/siCy55/10/20 complexes versus negative control (scale bars = 50 μm). b Flow cytometry analysis of transfected HaCaT cells by GT/siFAM5/10/20 complexes. c Images by confocal microscopy of HaCaT cells incubated with LysoTracker Green and GT/siCy510 complexes for 8 h (scale bars = 20 μm). d Western Blot quantification of the cellular level of MMP-9 protein and e qRT-PCR quantification of the cellular level of MMP-9 mRNA after treatment with GT/siMMP-95/10/20 complexes versus negative control. *P < 0.05 compared with negative control

