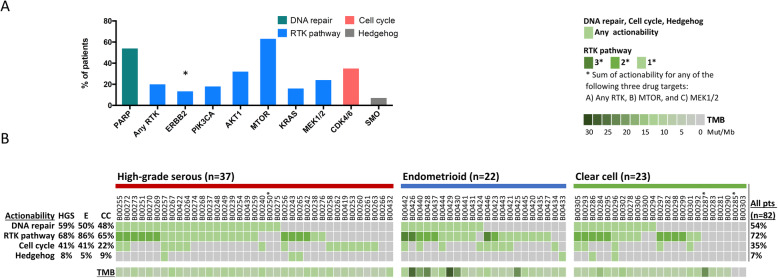
Fig. 5.
Summary of actionability and tumor mutational burden (TMB) for patients of different histological subtypes. The actionability of alterations in patients is displayed for different cancer signaling pathways/genes for the overall cohort (n = 82) (a). Only actionabilities for drug targets with at least five patients with potential eligibility for targeted therapy are shown. Statistical analysis was performed by the Chi-Square test for differential distribution of actionability for the displayed drug targets among histological subtypes (see Additional file 10). Statistical significance is displayed as *P < 0.05. An oncoprint plot depicts information for actionability and its overlap, as well as TMB, for individual patients with different histological subtypes (b). Histological subtypes are abbreviated as HGS = high-grade serous, E = endometrioid and CC = clear cell. In the oncoprint plot, * indicates a sample with low (20–30%) tumor purity

