
Fig. 2. Microbiome analyses before and after FMT in melanoma patients.
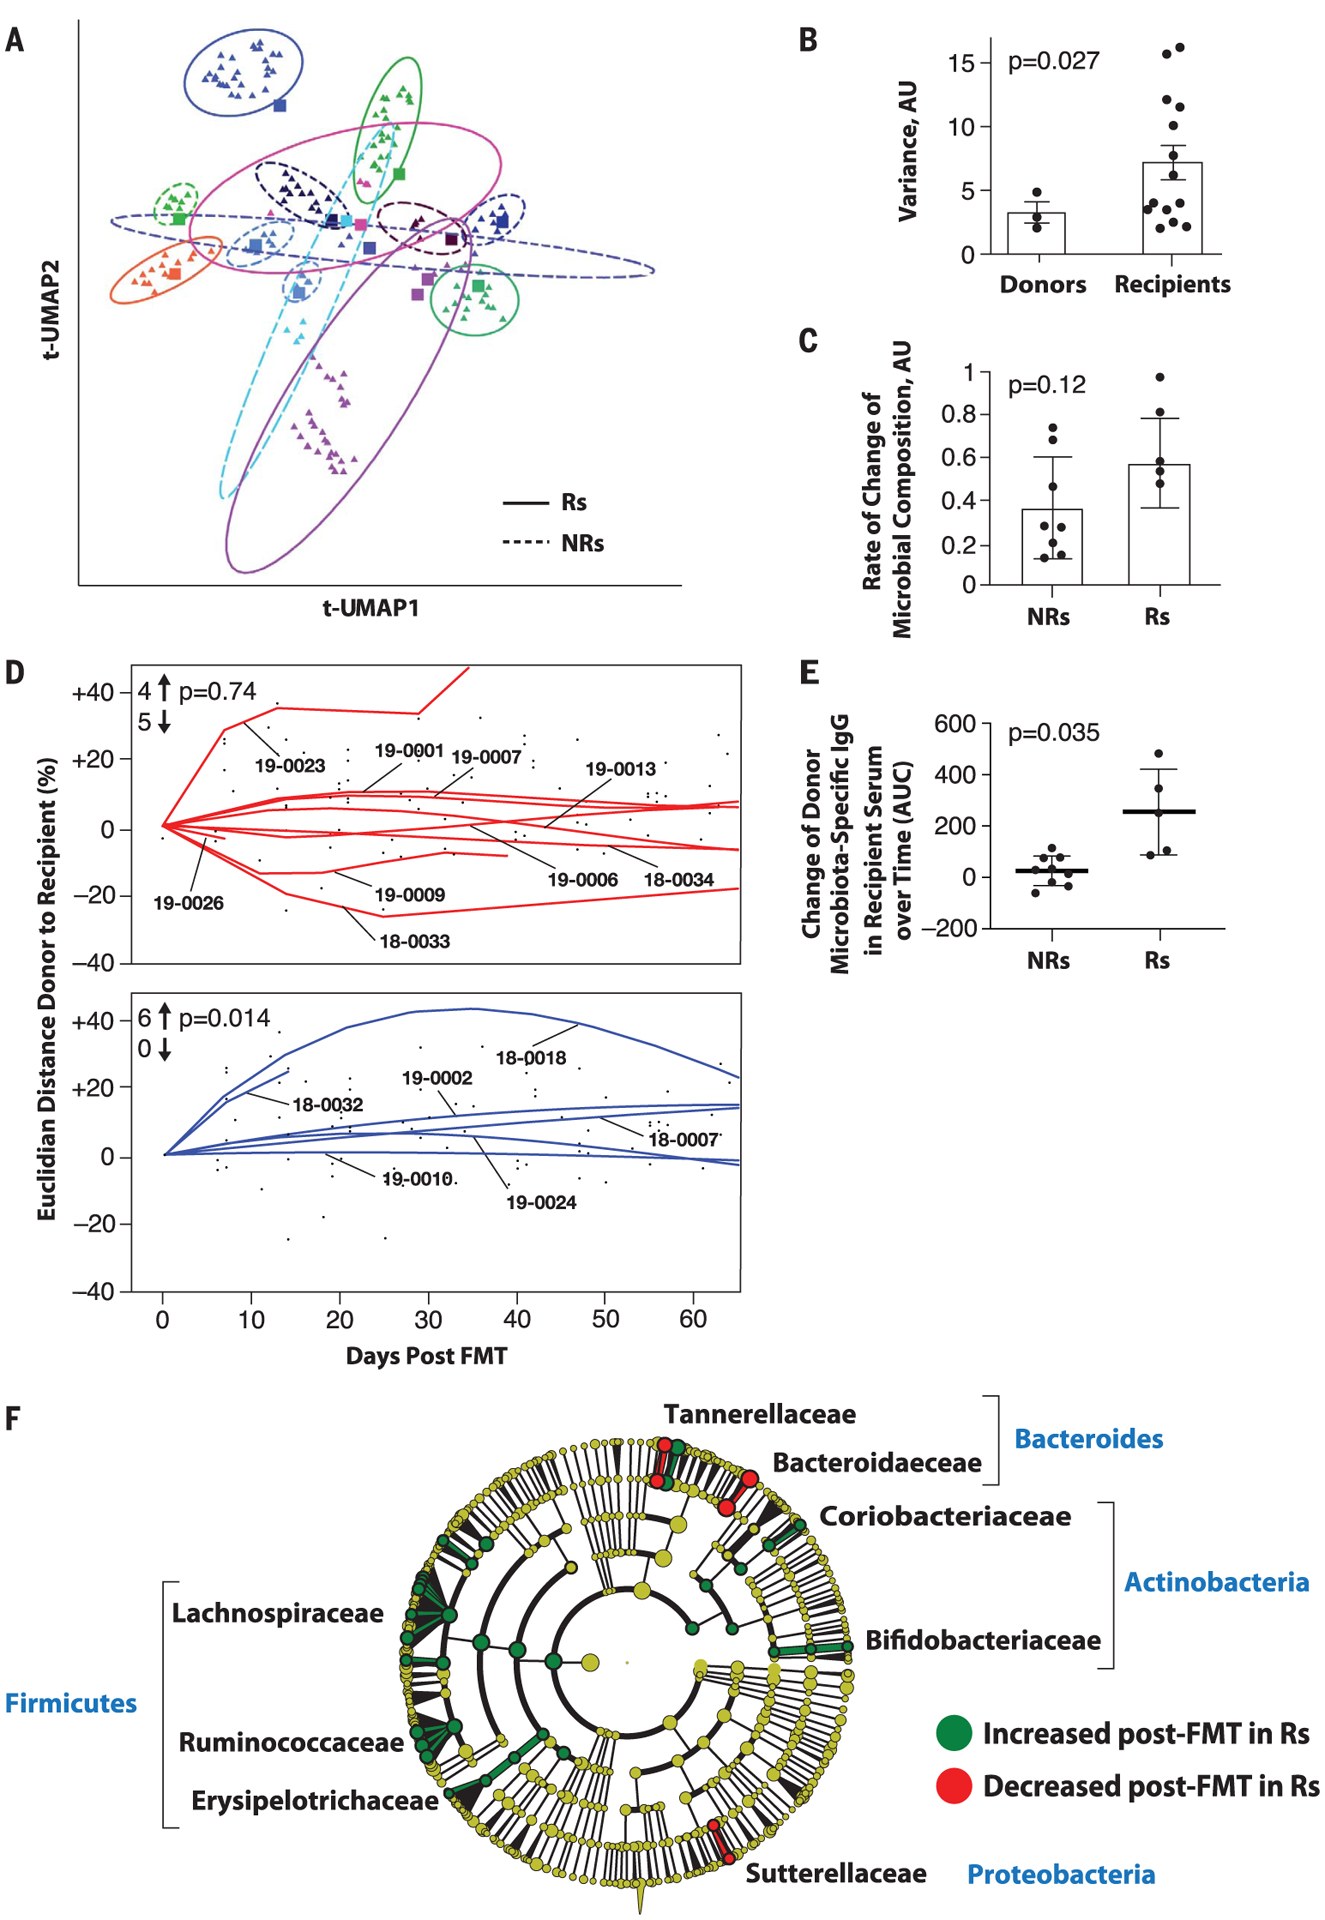
(A) Dimensionality reduction using t-distributed UMAP (t-UMAP) plot of microbial taxa abundances by last known taxon of FMT recipients at different time points. Each color corresponds to a different FMT-treated patient. Pre-FMT stool samples are depicted as squares and post-FMT stool samples as triangles. Ellipses encapsulate each recipient’s pre- and post-FMT samples, and the size of the ellipse spans two standard deviations from the centroid. Rs and NRs are distinguished by solid and dashed lines, respectively. PT-19–0026 (PD) is not depicted because the patient had a single post-FMT sample. (B) Intrapatient variance of stool samples from donors and recipients after standardization and dimensionality reduction. Donors (n = 3) and recipients (n = 15) who contributed at least three fecal samples are depicted. Data were standardized, PCA was performed, PC loading was computed, and variances of patients for every PC loading were calculated as the squared standard deviation divided by the mean and were multiplied by the PC variance contribution. Resultant values were added together to produce a combined variance number, which was compared between donors (n = 3) and recipients (n = 15) by using the nonparametric t test. AU, arbitrary units. (C) Rate of taxonomic change of stool samples sequentially obtained from treated patients. The rate of taxonomic change for each sample sequentially obtained from each patient was calculated by using speed of traversion (Euclidean distances traversed per day), which was calculated by dividing total Euclidean distance traveled by days. Euclidean distance was calculated by using log-transformed normalized taxonomic data from shotgun sequencing between Rs (n = 6) and NRs (n = 9) by using the nonparametric t test. (D) Plot of Euclidean distance over time from patients’ gut microbiota to corresponding FMT donor’s microbiota. To assess the efficiency of FMT engraftment, Euclidean fitted curves were generated by using points on the graph in both NRs (red, above) and Rs (blue, below). A positive percentage of each curve indicates similarity to the corresponding donor, whereas a negative percentage indicates changes in the recipient microbiota even further from the donor microbiota. Graphs were normalized by truncating at 60 days in both Rs and NRs. The chi-square test was calculated by using an even distribution as null hypothesis. (E) Recipient IgG response against donor microbiota induced by FMT. Donor fecal bacteria were incubated with recipient sera at 1:200 dilutions, washed and stained with phycoerythrin-labeled antihuman IgG, and fixed and analyzed on a flow cytometer. Change in IgG positivity of donor fecal bacteria for each FMT recipient was calculated in relation to the first FMT recipient serum sample available compared with the subsequent two time points up to 50 days later. Percent IgG-positive donor fecal bacteria was assessed, and area under the curve (AUC) for percent IgG-positive donor bacteria was calculated, adjusting all recipient time points relative to the baseline time point set to zero. Difference in reactivity between sera from Rs and NRs was evaluated by Student’s t test. (F) Cladogram visualization of phylogenetic distribution of differentially abundant taxa before and after FMT in responding patients. Fisher’s method for meta-analyses was used to validate statistical significance and calculate effect size of the differential abundances of taxa in Rs (fig. S10). Differentially abundant taxa are color coded on the basis of relative abundance in post-compared with pretransplant samples (green, higher; yellow, unchanged; red, lower). The most significantly associated taxa are highlighted at the family level.