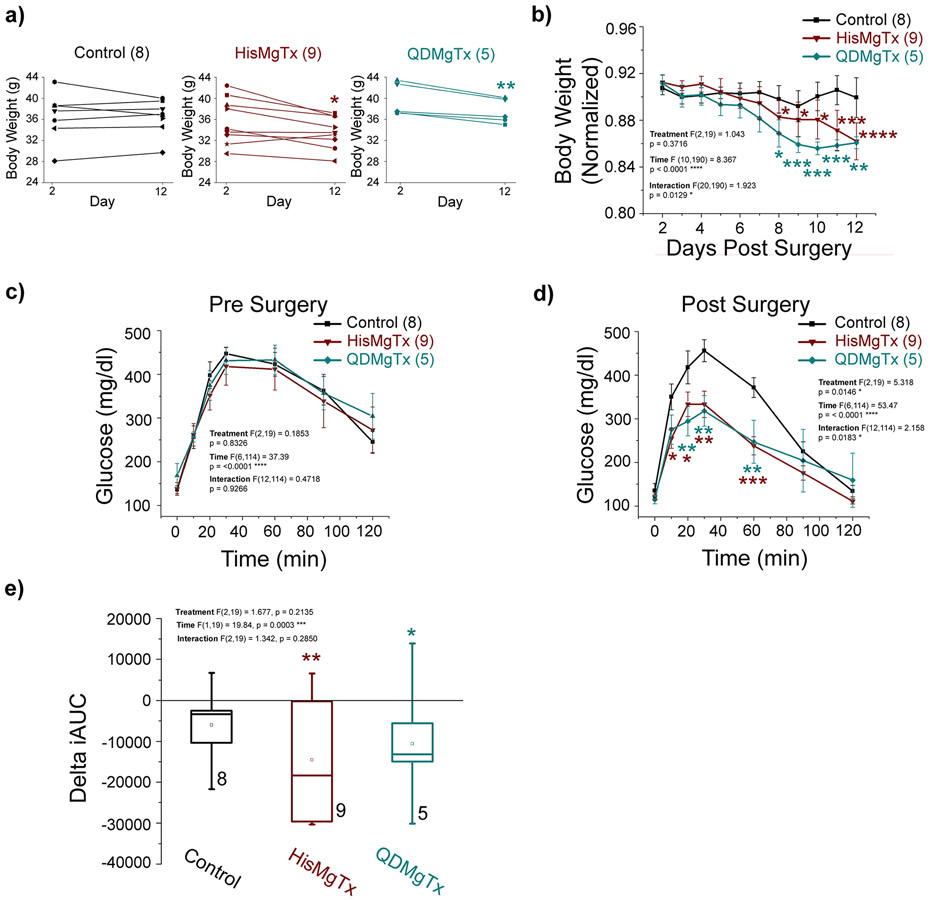
FIGURE 7.
Obese mice receiving a Kv1.3 inhibitor delivered to the OB had reduced body weight and cleared glucose more quickly. a) Body weight on day 2 vs. day 12 for individual mice. b) Normalized body weight versus time. Glucose clearance on c) Pre (−6) and d) Post Surgery (13). e) Box plot of the change in iAUC for data in (c-d). Data represent mean ± SEM. PBS: n = 8; HisMgTxFSU: n =9; QDMgTx: n = 5. a) paired t-test within treatment, * p < 0.05. b-e) Two-way RM ANOVA with factors of treatment, time, and interaction as noted. b) Bonferroni’s post hoc test * p < 0.05, ** p < 0.01, *** p < 0.001, **** p < 0.0001 significantly-different from day 2. c-d) Bonferoni’s post-hoc test * p < 0.05, ** p < 0.01, *** p < 0.001 significantly-different from PBS Control. e) one-way ANOVA, Bonferroni’s post-hoc test significantly-different than Day −6, * p < 0.05, ** p < 0.01. Sample size (n) = number of mice.

