
Extended Data Fig. 7. H3K9ac disease-specific gain at CREBBP but not EP300.
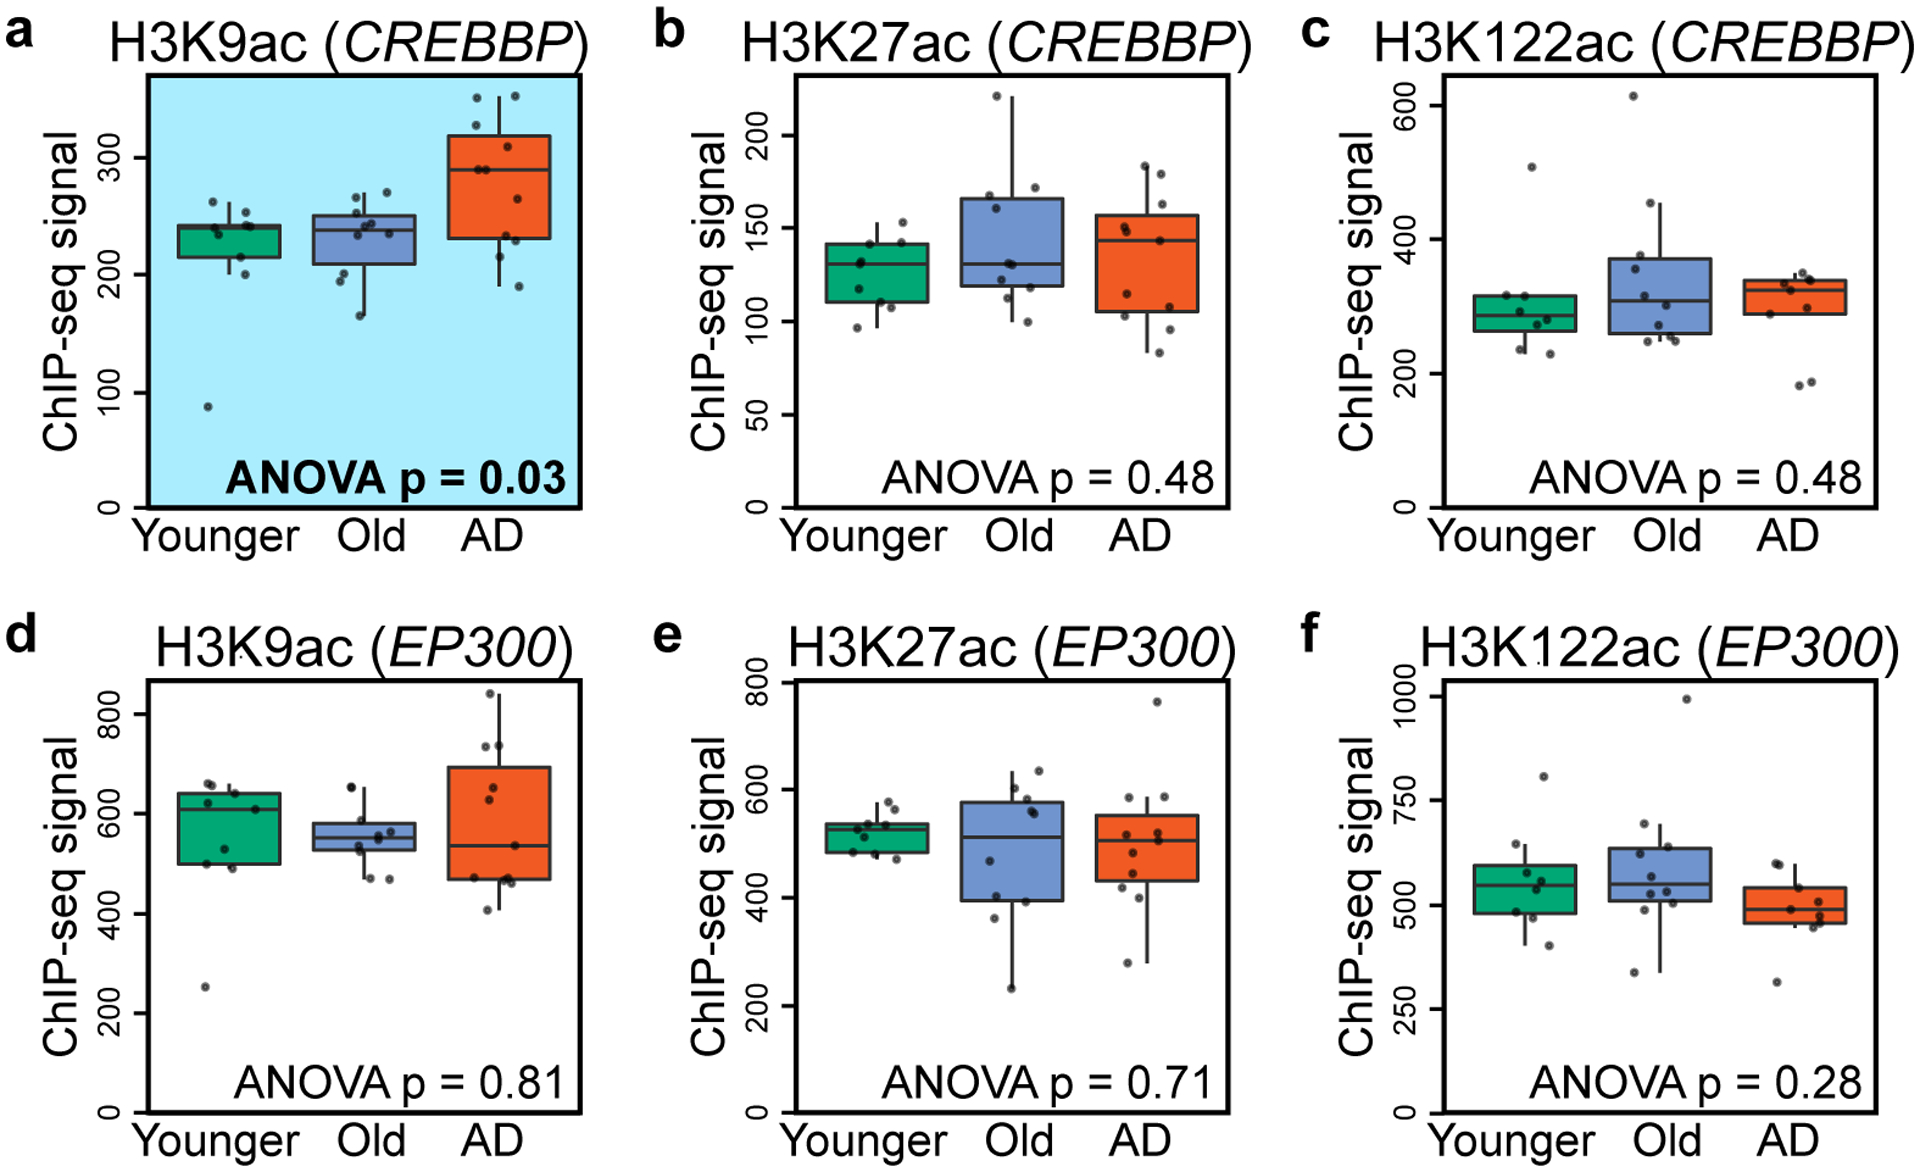
(a-c) Boxplot showing (a) H3K9ac, (b) H3K27ac and (c) H3K122ac peak enrichment at the CREBBP gene in Younger, Old and AD. A H3K9ac disease-specific gain is observed at CREBBP (highlighted in blue in a). (d-f) Boxplot showing (d) H3K9ac, (e) H3K27ac (f) H3K122ac peak enrichment at the EP300 gene in Younger, Old and AD showing no disease-specific changes. The closest peak to the gene was considered for this analysis. P-values comparing peak enrichment across Younger (N = 8–9), Old (N = 10) and AD (N = 9–11) (Supplementary Table 2) (1-way ANOVA) are reported in each panel. Boxplots show minimum, first quartile, median (center line), third quartile and maximum. Dots overlaid on boxplots represent individual data points.