
Extended Data Fig. 8. Functional analysis of H3K27ac and H3K9ac disease-specific losses.
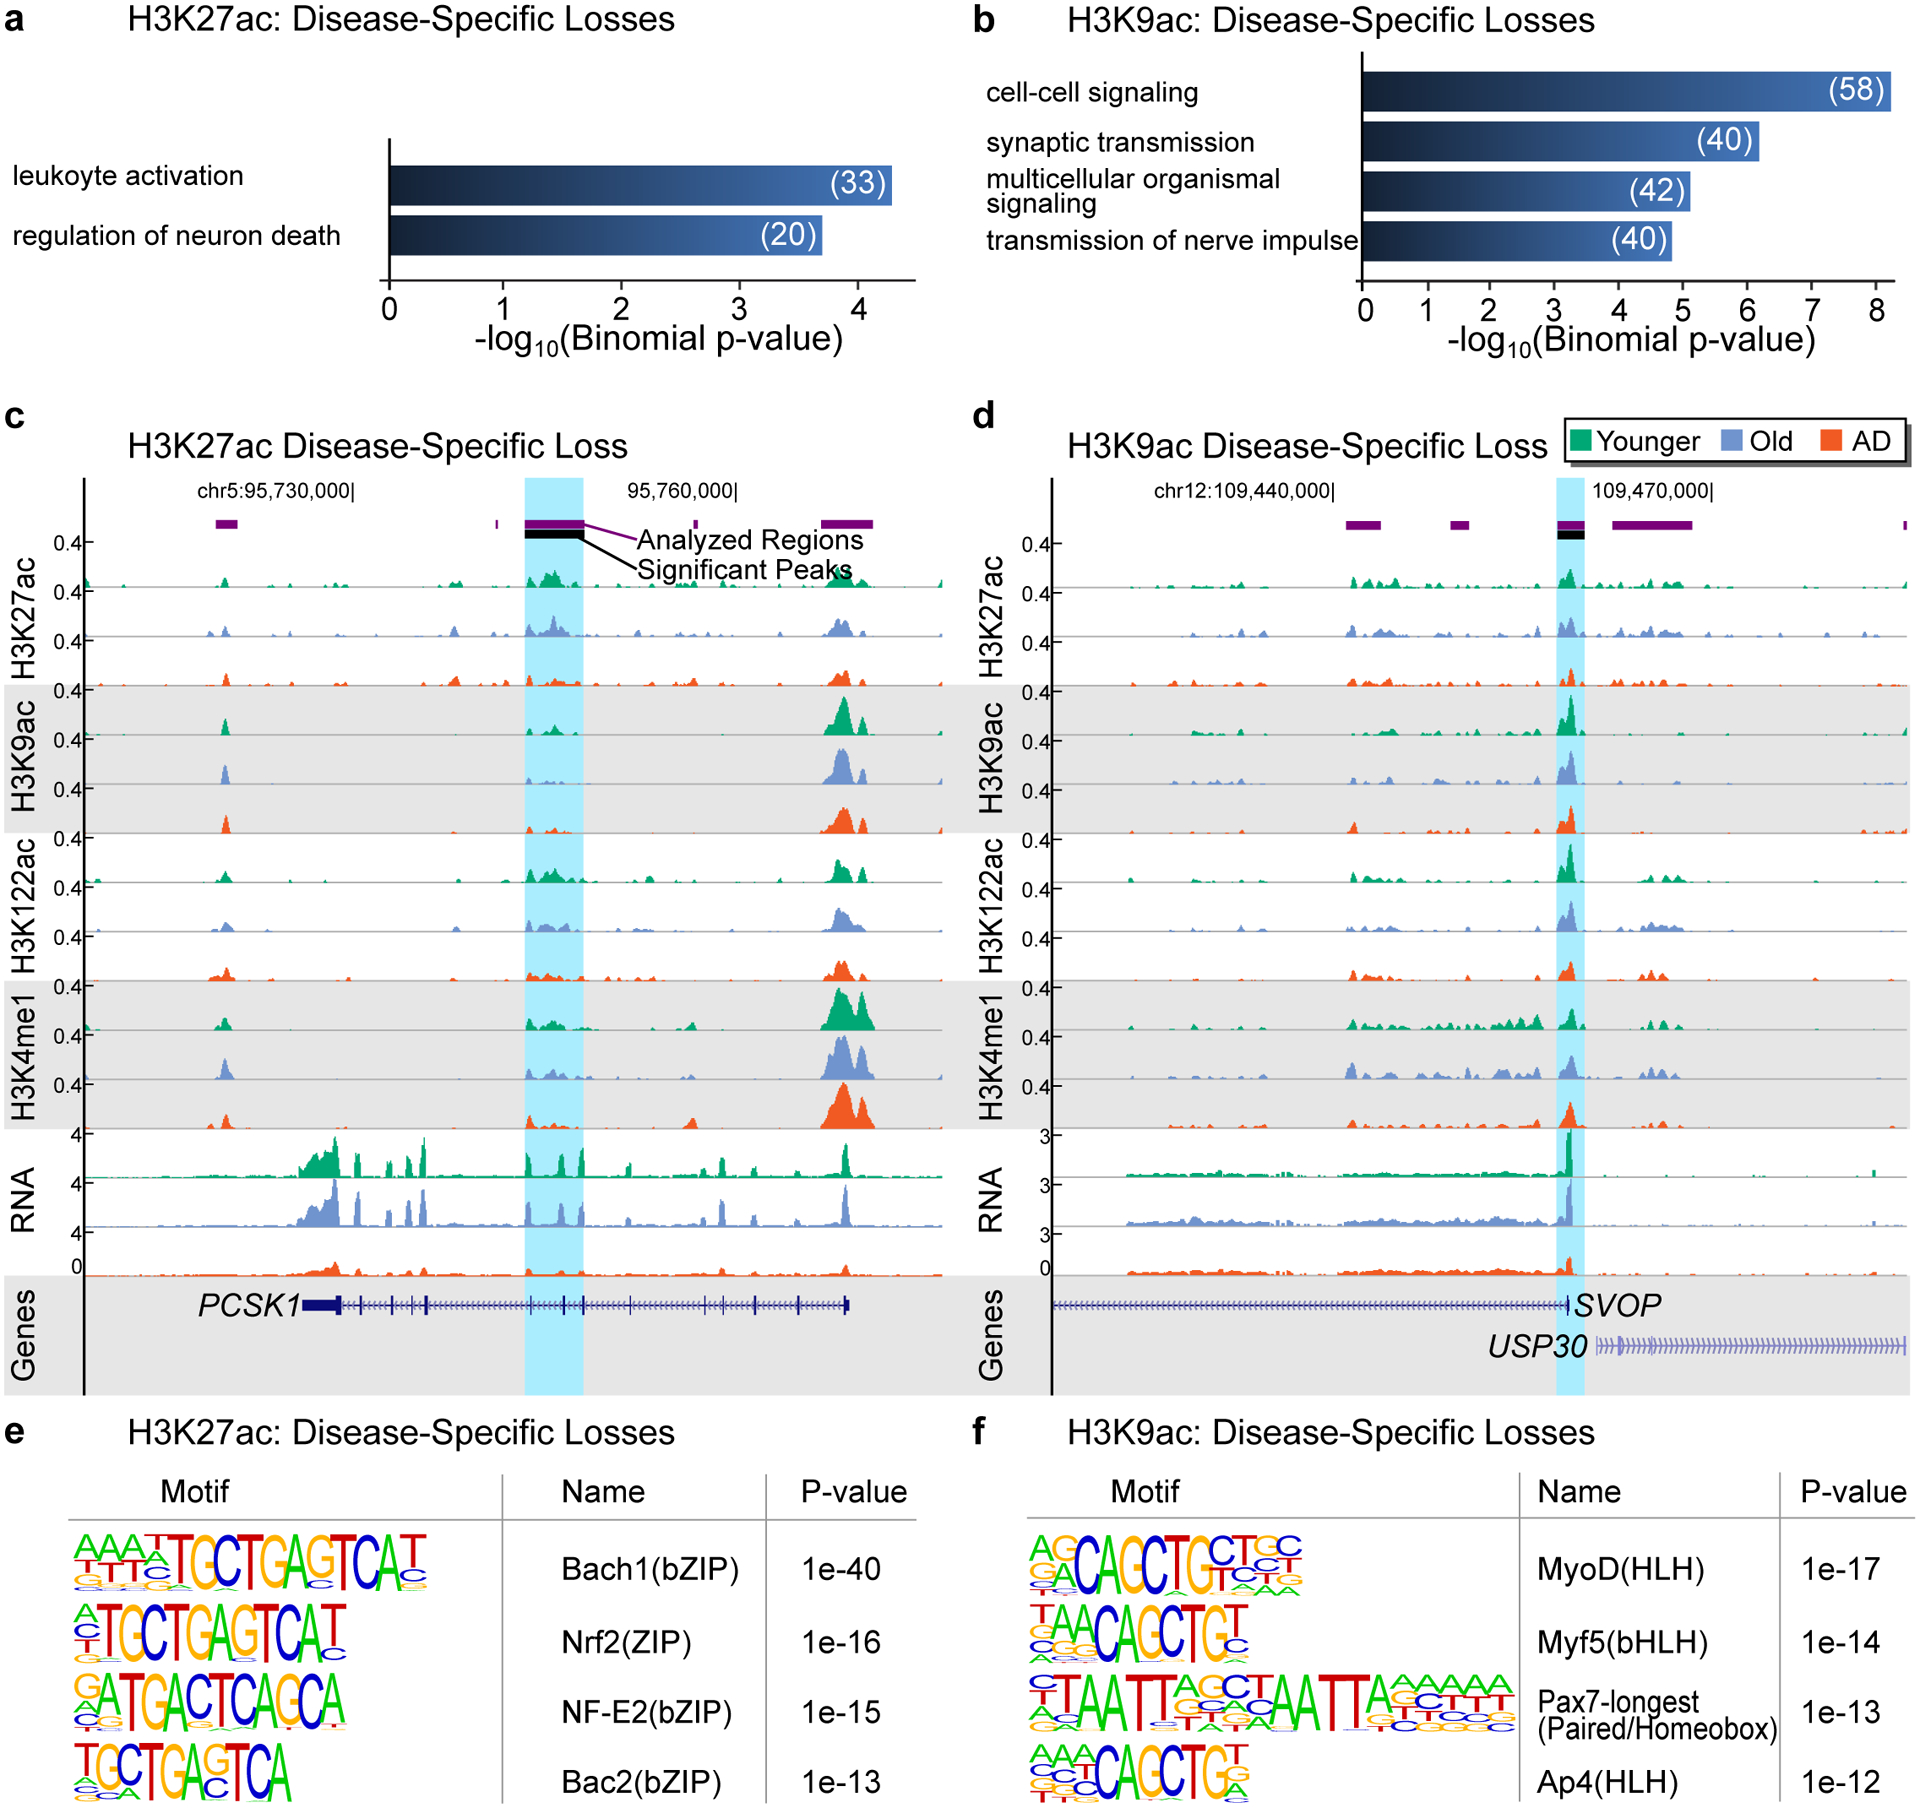
(a,b) Barplot showing top GO terms (Biological Processes; GREAT, FDR < 5%, % by both the binomial and the hypergeometric tests) for (a) H3K27ac disease-specific losses and (b) H3K9ac disease-specific losses for terms with at least 20 genes. (c,d) UCSC genome browser view showing an example of (c) H3K27ac disease-specific loss at the PCSK1 gene and (d) H3K9ac disease-specific loss at the SVOP gene. H3K27ac, H3K9ac, H3K122ac, H3K4me1 ChIP-seq and RNA-seq tracks are showed for Younger, Old and AD. (e,f) Top DNA motifs (HOMER v4.6) for (e) H3K27ac disease-specific losses and (f) H3K9ac disease-specific losses in AD. Enrichment results are shown for known motifs (q < 0.05, Benjamini-Hochberg).