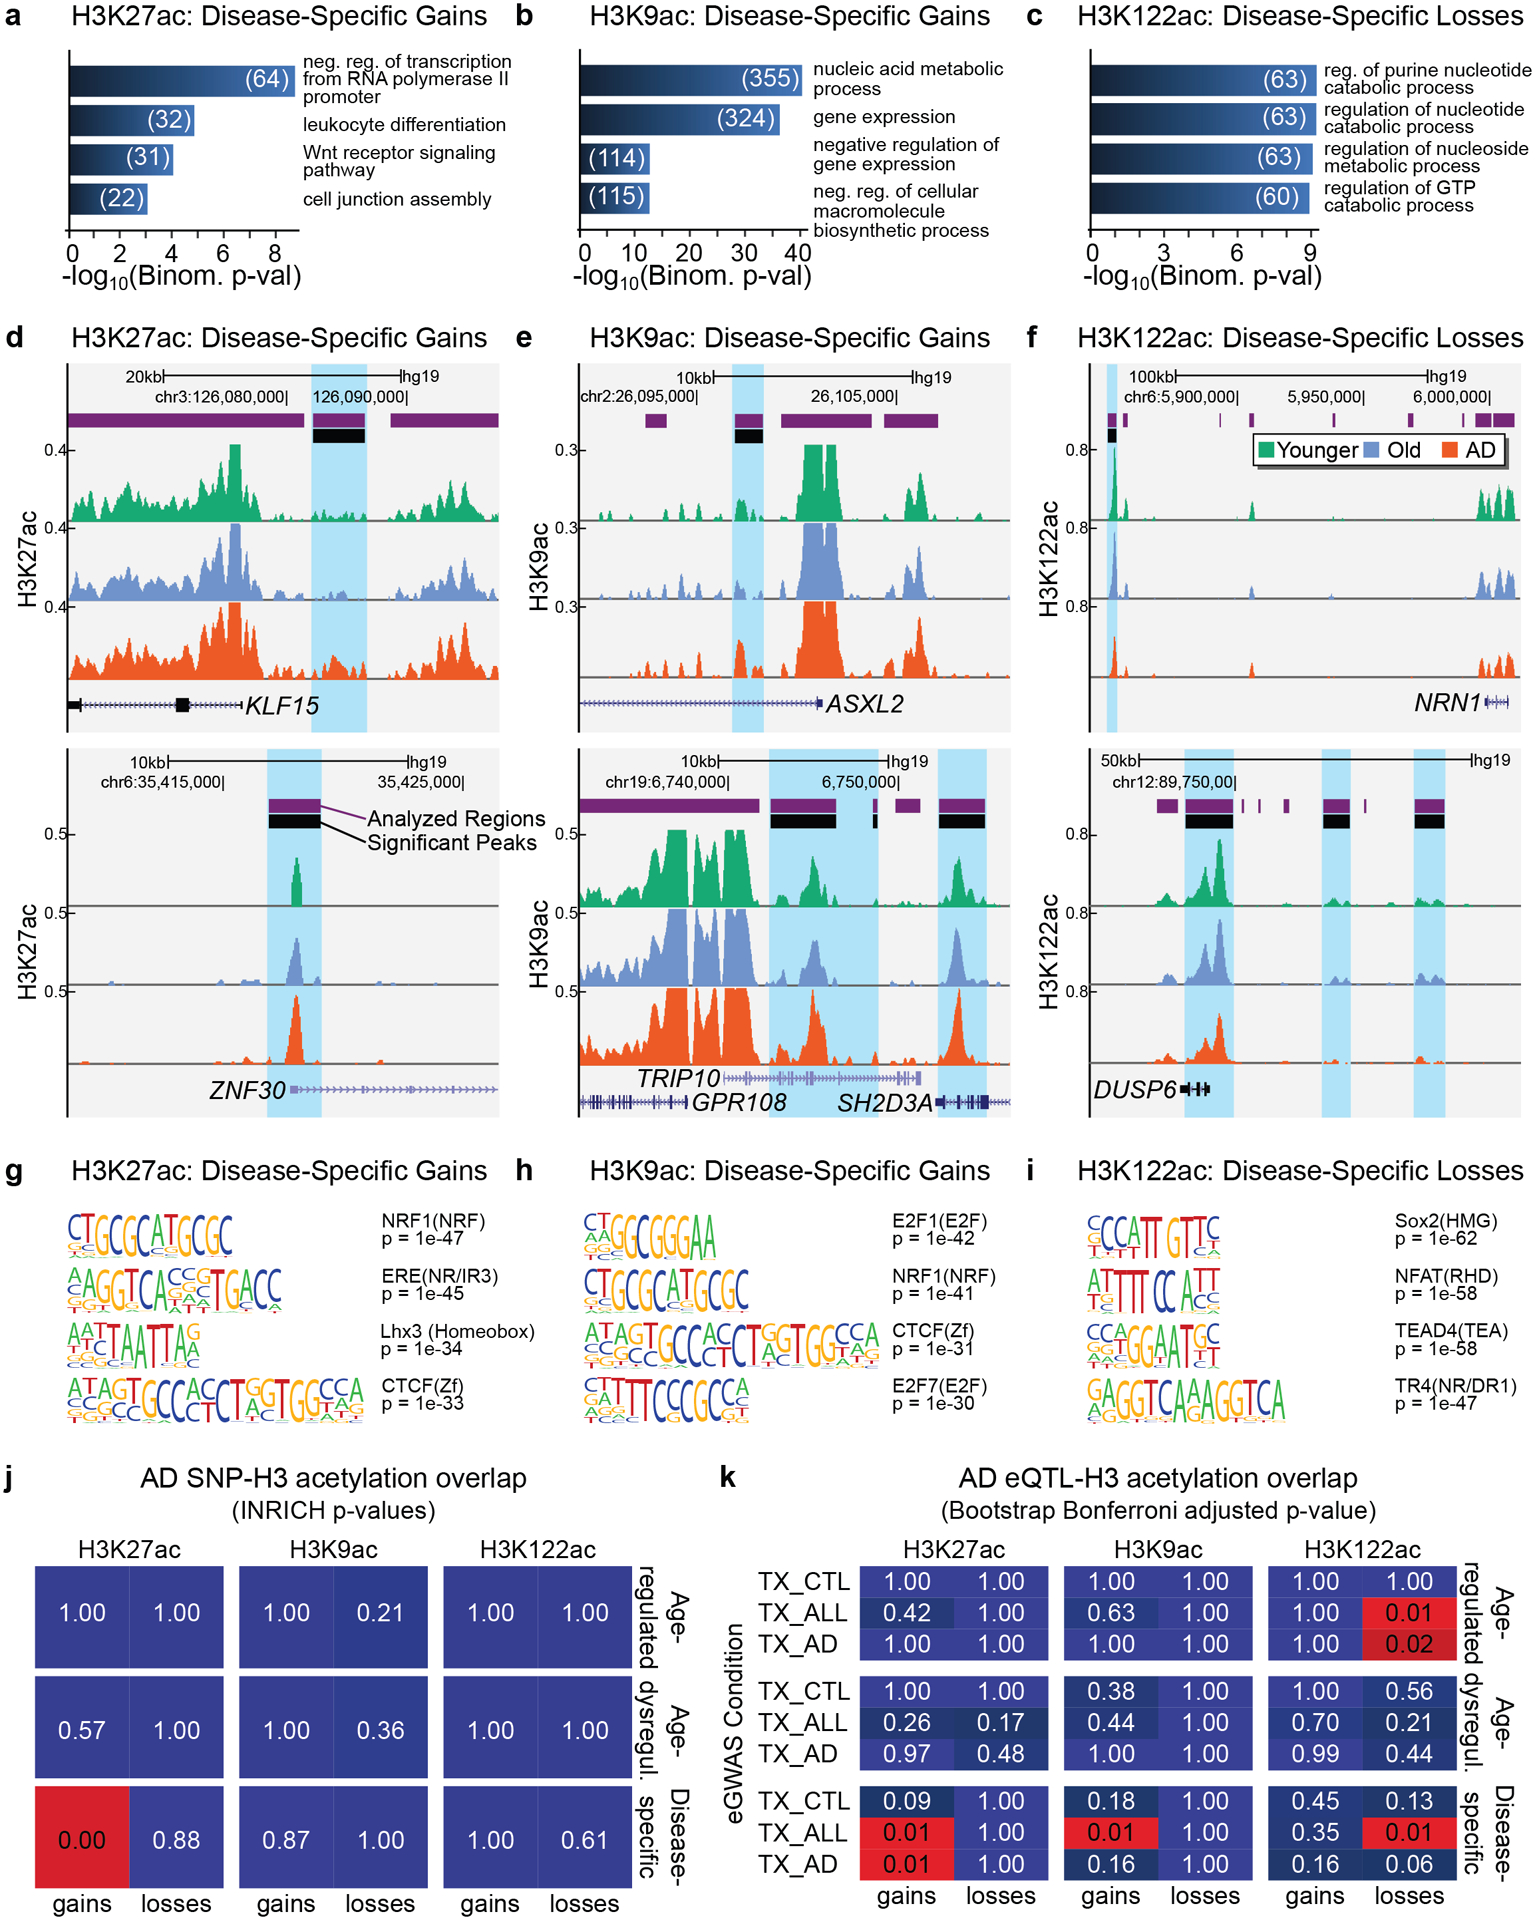
Figure 4. H3K27ac and H3K9ac disease-specific gains are associated with epigenetic- and disease-related pathways in AD.

(a-c) Barplot showing top GO terms (Biological Processes; GREAT, FDR < 5% by both the binomial and the hypergeometric tests) for (a) H3K27ac disease-specific gains, (b) H3K9ac disease-specific gains and (c) H3K122ac disease-specific losses (n genes per term ≥ 20). The number of genes in each term is also reported. (d-f) UCSC ChIP-seq tracks showing examples of (d) H3K27ac disease-specific gains, (e) H3K9ac disease-specific gains and (f) H3K122ac disease-specific losses in AD. (g-i) Top DNA motifs (HOMER v4.6) for (g) H3K27ac disease-specific gains, (h) H3K9ac disease-specific gains, (i) H3K122ac disease-specific losses. Enrichment results are shown for known motifs (q < 0.05, Benjamini) (j) Heatmap showing the significance by INRICH (adjusted P values) of the association between AD-SNP regions and the six classes of H3K27ac, H3K9ac and H3K122ac changes. (k) Heatmap showing Bonferroni adjusted P values for sampling-based analysis for the overlap of each of the six classes of H3K27ac, H3K9ac and H3K122ac changes with temporal cortex (TX) eQTLs from Zou et al.87. eQTLs were split into those from AD cases (TX_AD), non-AD but with other neuropathologies (TX_CTL), and combined conditions (TX_ALL).
