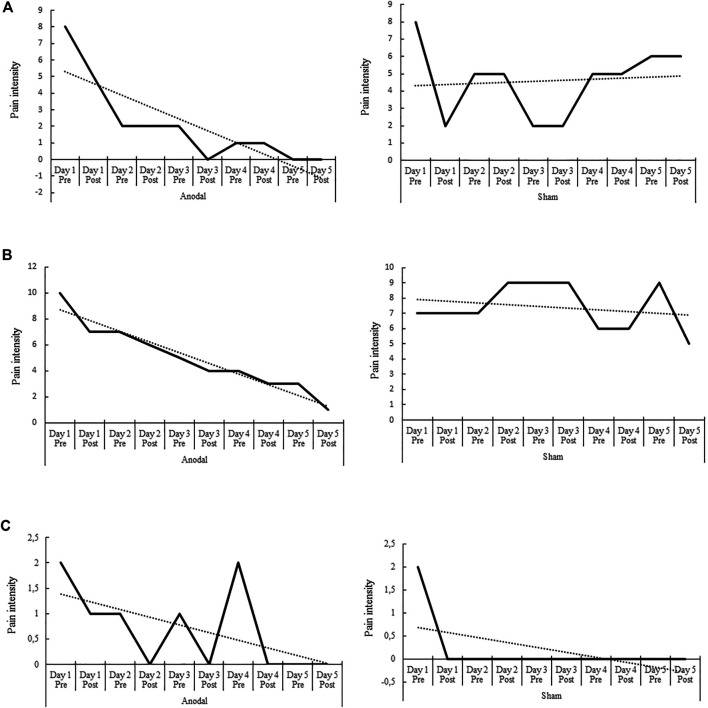
FIGURE 2.
Pre- and post-anodal and sham tDCS values of pain intensity of the Adaptive Visual Analog Scales of pain intensity and improvement (AVAS) for each of the three patients (A–C) throughout the five intervention sessions (day 1–5). The dotted line indicates the data trend. Significant differences between pain intensity mean values of the anodal and sham tDCS conditions were found in each patient (p = 0.005, p = 0.007, p = 0.028, respectively), with reduced pain intensity values after anodal tDCS in patients 1 and 2.

