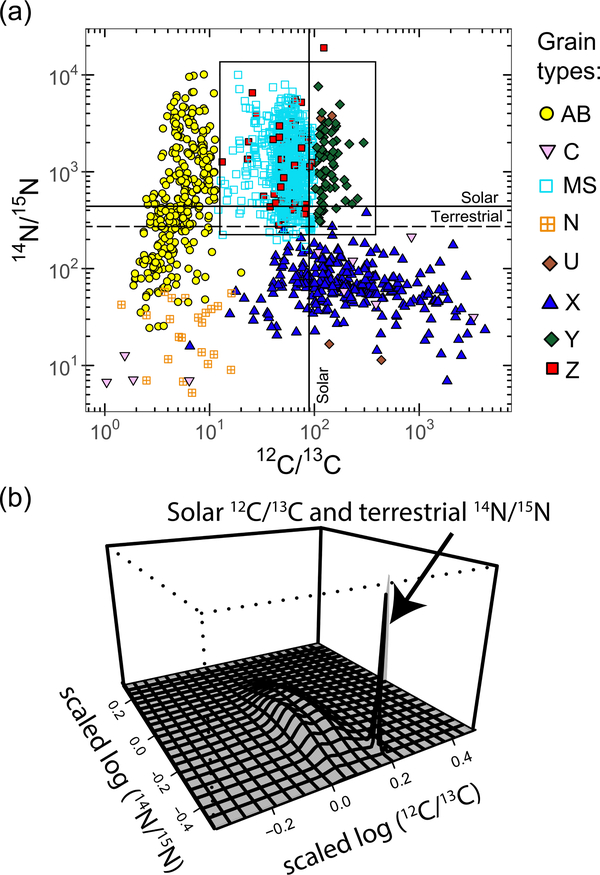
Figure 1.
Nitrogen and carbon (a) isotopic compositions of presolar SiC grains. Plotted data are from the updated PGD (Stephan et al. 2020). We used the following standard isotopic ratios: (12C/13C)solar = 89 (Lambert & Mallia 1968), (14N/15N)solar = 440 (Marty et al. 2011), and (14N/15N)terrestrial = 272 (Junk & Svec 1958). (b) is a perspective plot of the bivariate density distribution, scaled to an average of zero and unit standard deviation, for the area shown with the square in (a). Grains likely affected by solar system contamination create a peak at the solar 12C/13C and terrestrial 14N/15N isotopic ratios (b).

