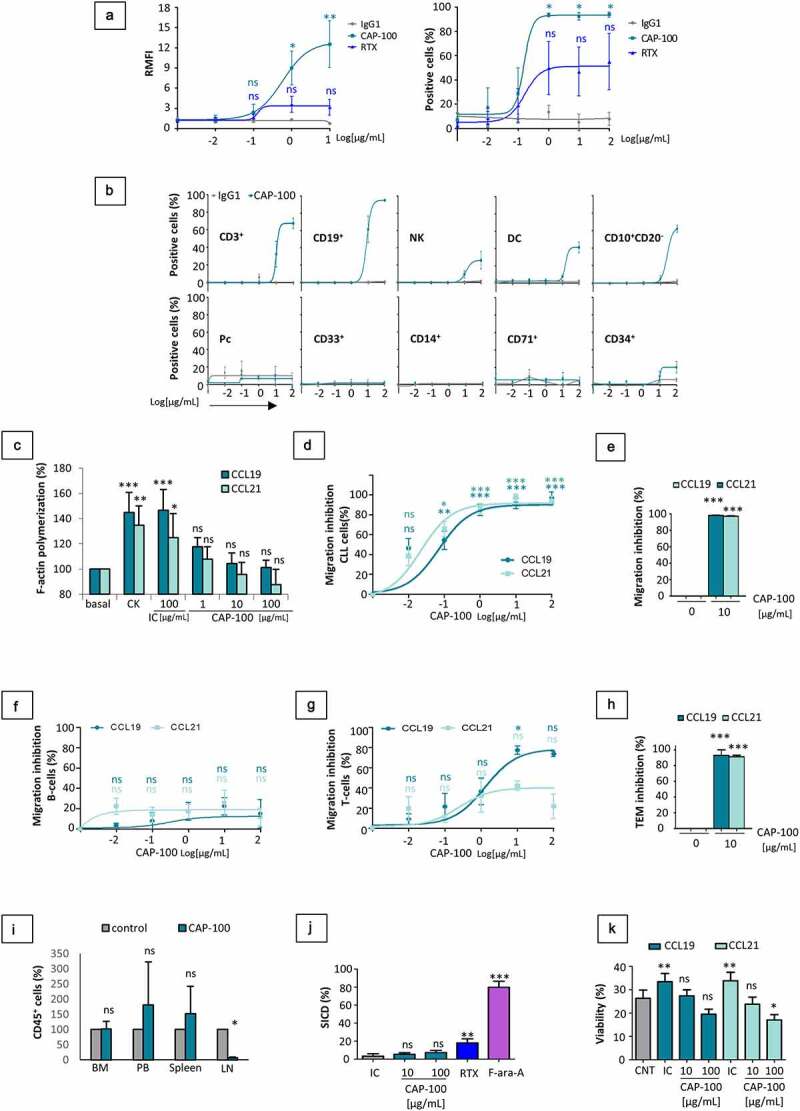
Figure 2.

CAP-100 Fab region binds to CCR7 expressed in CLL cells and neutralizes target-induced signaling, chemotaxis, TEM, homing and survival. A) CAP-100 binds to CCR7 expressed in CLL cells from patients with high-risk samples (with del17p and/or refractory disease to anti-CD20 therapy or ibrutinib). Binding was tested by flow cytometry at the indicated concentration range. The therapeutic anti-CD20 rituximab (RTX) was used as reference antibody. Results are expressed as the relative median fluorescence intensity (RMFI, arbitrary units) normalized to the IgG1 isotype control (trastuzumab), or percentage of positive cells. Dots represent mean ± SEM (n = 4 patients). B) CAP-100 binds to CCR7+ non-tumor cells from healthy donors at high experimental concentrations. Cells from PB or BM were incubated with CAP-100 or trastuzumab (matched hIgG1) at different final concentrations and analyzed by flow cytometry. The graphs show analysis in PB (CD3+ T cells, CD19+ B cells, NK cells, DCs, CD14+ monocytes, CD33+ granulocytes), and in BM (immature CD19+CD10+CD20− B cells, CD19+ plasma cells (Pcs), CD71+ erythroblasts, and CD34+ precursors). Dots represent mean ± SEM (n = 3 donors). C) CAP-100 neutralizes CCR7-induced signaling on CLL cells. F-actin polymerization (% relative to baseline) was used as surrogate marker of CCR7-signaling and migration. CLL cells were pre-incubated with trastuzumab (IC, 100 µg/ml), CAP-100 (1, 10, and 100 µg/ml) or left untreated prior to stimulation with CCR7 ligands (1 µg/ml for 0.5 minutes). Polymerization was detected by flow cytometry. Bars represent the mean ± SD (n = 5 patients). D) CAP-100 neutralizes CCR7-mediated CLL cells migration in response to CCL19 or CCL21. Chemotaxis of CLL cells was assayed in uncoated transwell chambers for 4 h. CCL19 and CCL21 (1 µg/mL) were used as chemoattractant in the bottom chamber. Data were normalized to the maximal and minimal response observed in the presence of ligand and medium (basal/spontaneous migration), respectively. The graph shows the mean percentage of inhibition ± SEM (n = 16 patients). E) CAP-100 neutralizes CCR7-mediated T-cell prolymphocytic leukemia (T-PLL) cells migration toward CCR7 ligands. The specific blocking of CCR7-ligand interactions, expressed as the percentage of inhibition toward 1 µg/mL CCL19/21-induced migration is shown for T-PLL cells incubated with CAP-100 or a matched IC (10 µg/mL). Bars represent the mean ± SEM (n = 3 patients). F) CAP-100 minimally impairs CCR7-mediated migration in healthy B cells. The specific blocking of CCR7-ligand interactions, expressed as the percentage of inhibition of CCL19/21-induced migration is shown for B cells. Graph shows mean ± SEM (n = 3 HD). G) CAP-100 moderately inhibits migration in healthy T cells. The specific blocking of CCR7-ligand interactions, expressed as the percentage of inhibition of CCL19/21-induced migration is shown for T cells. Graph shows mean ± SEM (n = 3 HD). H) CAP-100 inhibits target-mediated CLL cells migration across endothelium. CLL cells migration was assayed in transwell filters coated with TNFα-activated HUVEC, in the presence or absence of CAP-100 (10 µg/mL) and CCR7 ligands (1 µg/mL). The percentage of inhibition (mean ± SEM) is shown (n = 5 patients). I) CAP-100 reduces in vivo homing to LN. In this model, CCR7-expressing lymphocytes were pre-incubated with CAP-100 or a matched IC (trastuzumab) at 10 µg/ml before tail vein injection into irradiated NSG mice (n = 5 per group). One hour later, mice were sacrificed and target cells found in LN, BM from femurs, spleen and PB enumerated by flow cytometry. The graph shows the mean proportion ± SD of hCD45+ lymphocytes in 106 cell suspensions from each tissue (normalized to control group). J) CAP-100 does not trigger specific-induced cell death (SICD) upon binding to CCR7 expressed on CLL cells. Leukemic cells were either treated with CAP-100 (10 or 100 µg/ml), an IgG1 control antibody (trastuzumab, 100 µg/ml), rituximab (RTX, 100 µg/ml), or with fludarabine (F-ara-A; 10 µmol/L) for 24 hours followed by flow cytometry analysis. The graph shows % SICD for each compound. Mean ± SD is shown (n = 13 patients). K) CAP-100 inhibits CCR7-induced survival in CLL. Cells were incubated with an isotype control (IC, 100 µg/ml) or with CAP-100 (10 µg/ml or 100 µg/ml) before long-term culture in 1% FBS medium alone or supplemented with CCR7 ligands (1 µg/mL). Cells incubated in medium alone, without chemokines or antibodies, were used as controls (CNT). Cell viability (%) was determined after 72 hours. Graph shows mean ± SEM (n = 8 HD). For all graphs: ns, not significant; * p < .05; ** p < .01; *** p < .001
