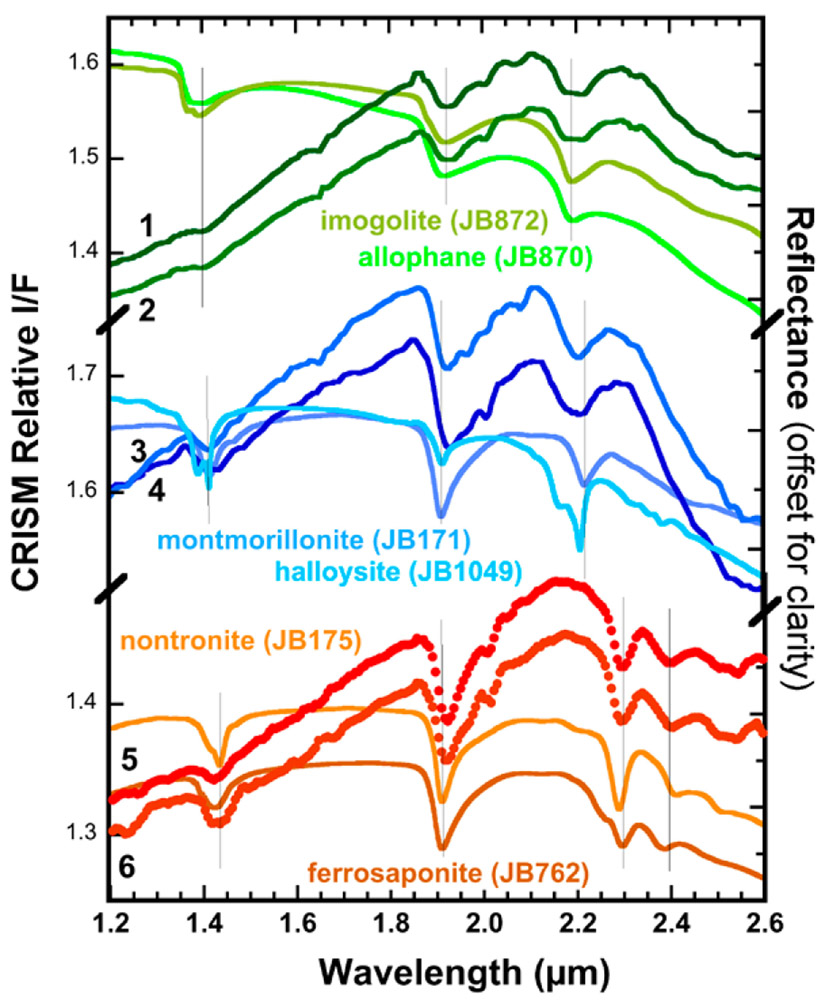
Figure 6.
I/F CRISM spectra from image FRT000094F6 representing the units colored green, blue, and red in Figure 5C. Spectra 1 and 2 are dominated by short-range ordered aluminosilicates, spectra 3 and 4 include Al-rich phyllosilicates, and spectra 5 and 6 include Fe-rich smectites. Lab spectra of minerals/materials are shown for comparison: allophane and imogolite from Bishop et al. (2013b), montmorillonite and halloysite from Bishop et al. (2008b), and nontronite and Fe/Mg smectite from Bishop et al. (2008a, 2008b). Grey vertical lines mark the spectral features due to H2O and metal-OH in the crystal structure that are used to characterize the phyllosilicates and related materials present in the regions associated with these spectra.

