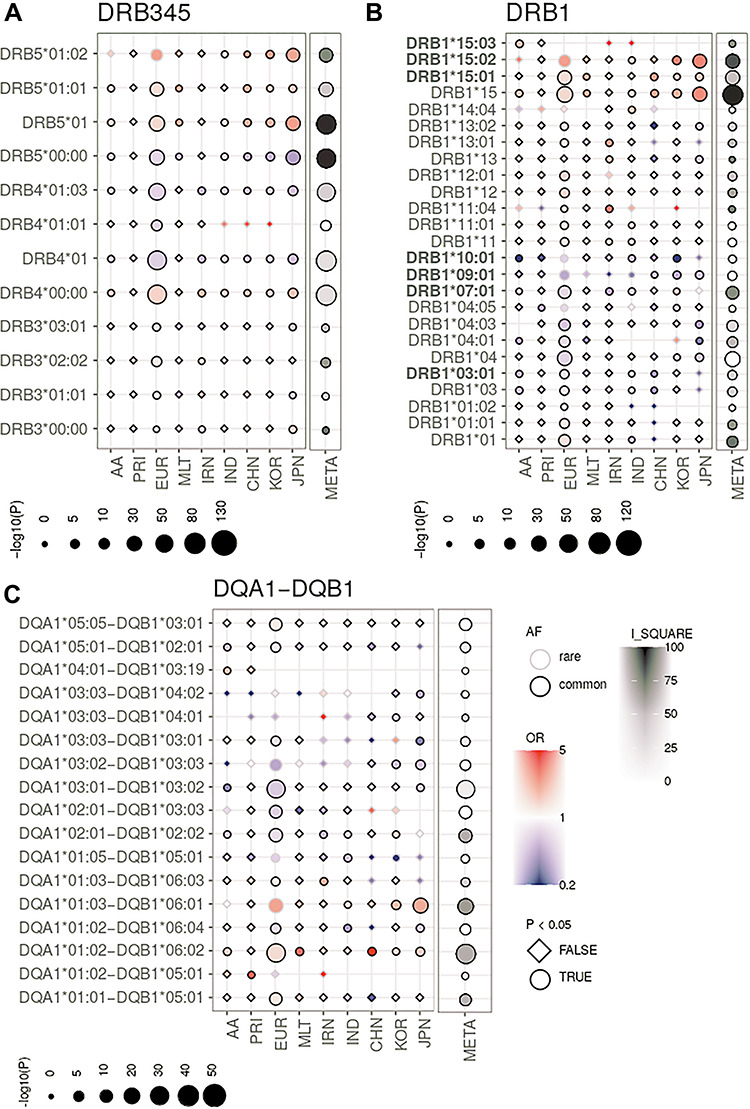
Figure 2.

HLA single allele association analysis results at 2- and 4-digit resolution for MHC class II loci (A) HLA-DRB3/4/5, (B) HLA-DRB1 and (C) HLA-DQA1-DQB1. (AF; common defined as AF > 1%), OR, P-value (P) and whether an allele had a P-value < 0.05 (circle symbol) is shown for the respective population (e.g. circles with black boundary and red color represent an allele that is common and associated with risk). We depict association results of the analysis of the African American (AA), Puerto Rican (PRI), Caucasian (EUR), Maltese (MLT), Iranian (IRN), North Indian (IND), Chinese (CHN), Korean (KOR) and Japanese (JPN) cohorts and the meta-analysis (META) with I_SQUARE as an indicator of allelic heterogeneity and the P-value of association (PVALUE_RE2), combined here with single study P-values. Only HLA alleles, which are significant in the meta-analysis, have an AF > 1% in at least one population and have a marginal post-imputation probability > 0.6 are shown. The strongest association signals in the meta-analysis are for risk alleles of the DRB1*15 group, i.e. DRB1*15:01, DRB*15:02 and DRB1*15:03 and the alleles located on the same respective haplotype (Fig. 3). Alleles with OR > 5.0 or OR < 0.2 (rare and nonsignificant alleles may have larger/smaller OR) values were ‘ceiled’ at 5.0 and 0.2, respectively. The ‘consistent alleles’ that are highlighted in Figure 3 are highlighted in bold type on the left side. Null alleles at the HLA-DRB3/4/5 loci are described as DRB3*00:00, DRB4*00:00 and DRB5*00:00, respectively.
