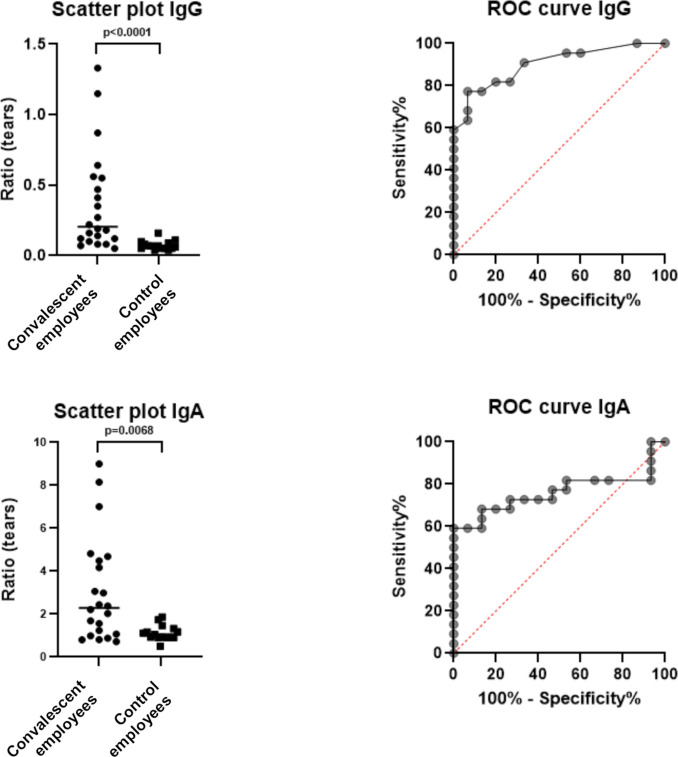
Figure 1.
Left: scatter plots of anti-SARS-CoV-2 IgG and IgA ratios in tear fluid, indicating the median by a horizontal line and p value between convalescent (n=22) and control employees (n=15). Right: ROC curves of anti-SARS-CoV-2 IgG and IgA ratios in tear fluid of convalescent and control employees. ROC, receiver operating characteristic.

