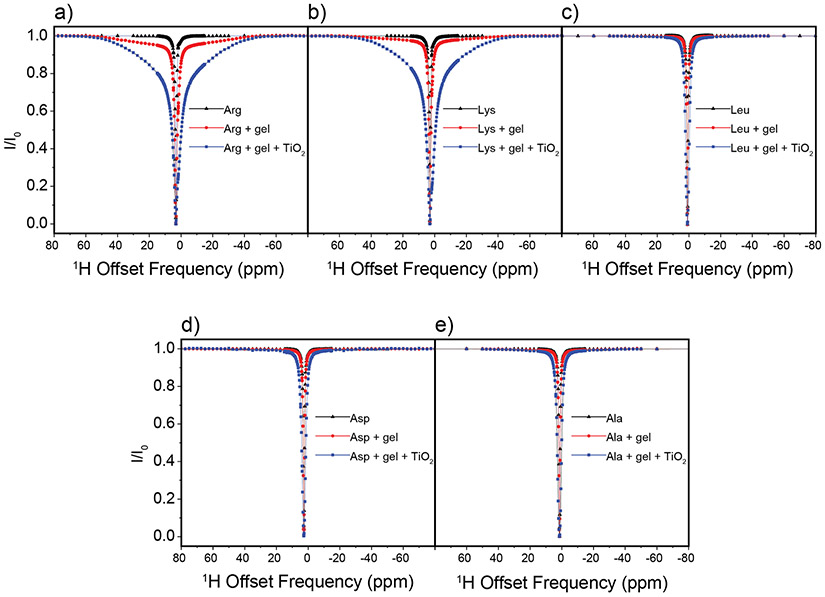
Figure 2.
1H DEST profiles for Hδ of 10 mM Arg (a), Hε of 10 mM Lys (b), Hδ of 10 mM Leu (c), Hβ of Asp (d), and Hβ of 10 mM Ala (e) neat (black), with 1% w/w agarose gel (red), and with 1% w/w agarose gel and 1% w/w TiO2 nanoparticles (blue). Slight peak broadening of the DEST profile upon addition of agarose gel for Arg and Lys (b-c) indicates a weak interaction between the agarose gel and the amino acids, and broadening upon addition to TiO2 indicates an interaction with the oxide.

