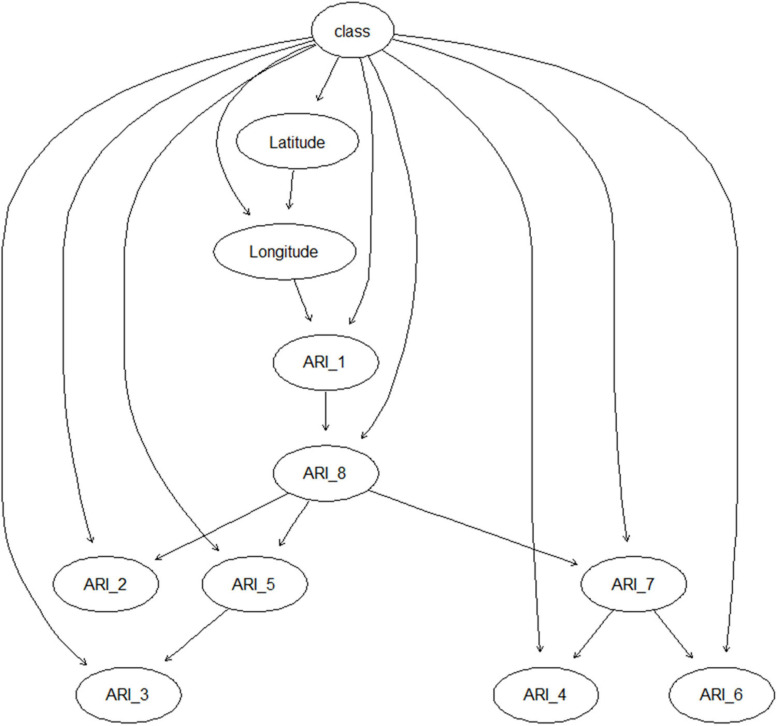
FIGURE 1.
Structure of PREMA resulting from learning the model with field data collected in the years 2012–2016 in Serbia. Circles represent nodes of the Bayesian network model, and arrows indicate the relationship/conditional dependencies among the nodes. ARI_1–8: aflatoxins risk index in sub-periods 1–8.

