Figure 3.
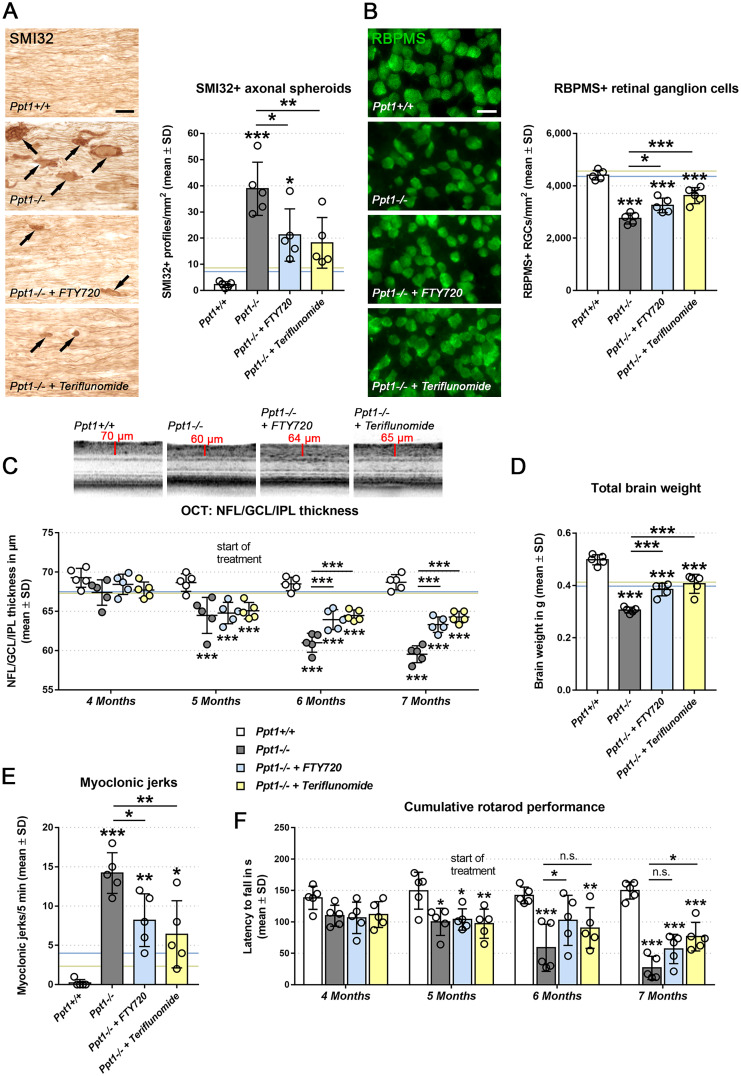
Therapeutic fingolimod and teriflunomide treatment improves histopathological and behavioural readout measures in CLN1 mice. (A) Representative light microscopy and quantification of SMI32+ axonal spheroids in optic nerves and (B) immune fluorescence microscopy and quantification of RBPMS+ retinal ganglion cells in retinae from 7-month-old Ppt1+/+, Ppt1−/−, fingolimod-treated Ppt1−/− (+ FTY720) and teriflunomide-treated Ppt1−/− (+ Teriflunomide) mice (circle = mean value of one mouse; n = 5 mice per group, one-way ANOVA and Tukey’s post hoc test). Scale bars: 20 µm. (C) Representative peripapillary OCT circle scans at 7 months and longitudinal analysis of NFL/GCL/IPL thickness (n = 5 mice per group, one-way ANOVA and Tukey’s post hoc test). (D) Total brain weights of 7-month-old Ppt1+/+, Ppt1−/−, fingolimod-treated Ppt1−/− and teriflunomide-treated Ppt1−/− mice (n = 5 mice per group, one-way ANOVA and Tukey’s post hoc test). (E) Quantification of myoclonic jerks in 7-month-old Ppt1+/+, Ppt1−/−, fingolimod-treated Ppt1−/− and teriflunomide-treated Ppt1−/− mice (circle = mean value of one mouse; n = 5 mice per group, one-way ANOVA and Tukey’s post hoc test). (F) Longitudinal analysis of cumulative Rotarod performance (circle = mean value of five consecutive runs of one mouse; n = 5 mice per group, two-way ANOVA and Tukey’s post hoc test). Blue and yellow lines (in b–e) indicate mean values from previously published preventive (from 1 to 6 months of age) fingolimod and teriflunomide treatment approaches, respectively. 9 *P < 0.05, **P < 0.01, ***P < 0.001.

