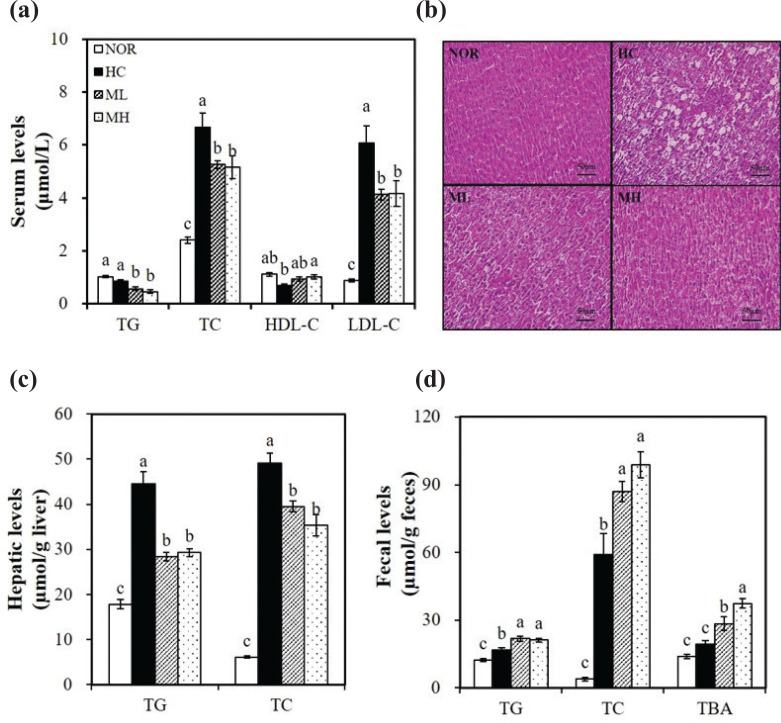
Fig. 2.
Effects of the high hydrostatic pressure mulberry leaf extract on serum, hepatic and fecal lipid profiles. (a) Serum lipid profiles. LDL-C = TC − HDL-C − (TG/5). (b) Representative hematoxylin and eosin (H&E)-stained liver sections (scale bars, 50 μm; magnification, 400X). (c) Hepatic lipid profiles. (d) Fecal lipid profiles together with bile acid levels. Values are expressed as mean ± SEM (n = 10). Bars with different letters (a, b, c) show significant differences (P < 0.05). HDL-C, HDL-cholesterol; LDL-C, LDL-cholesterol; TBA, total bile acid; TC, total cholesterol; TG, triglyceride. NOR, normal diet; HC, high-cholesterol diet containing 1% cholesterol and 0.5% cholic acid; ML, HC + 0.5% high hydrostatic pressure mulberry leaf extract; MH, HC + 1% high hydrostatic pressure mulberry leaf extract.

