. 2021 Apr 6;12(17):6037–6047. doi: 10.1039/d0sc05328g

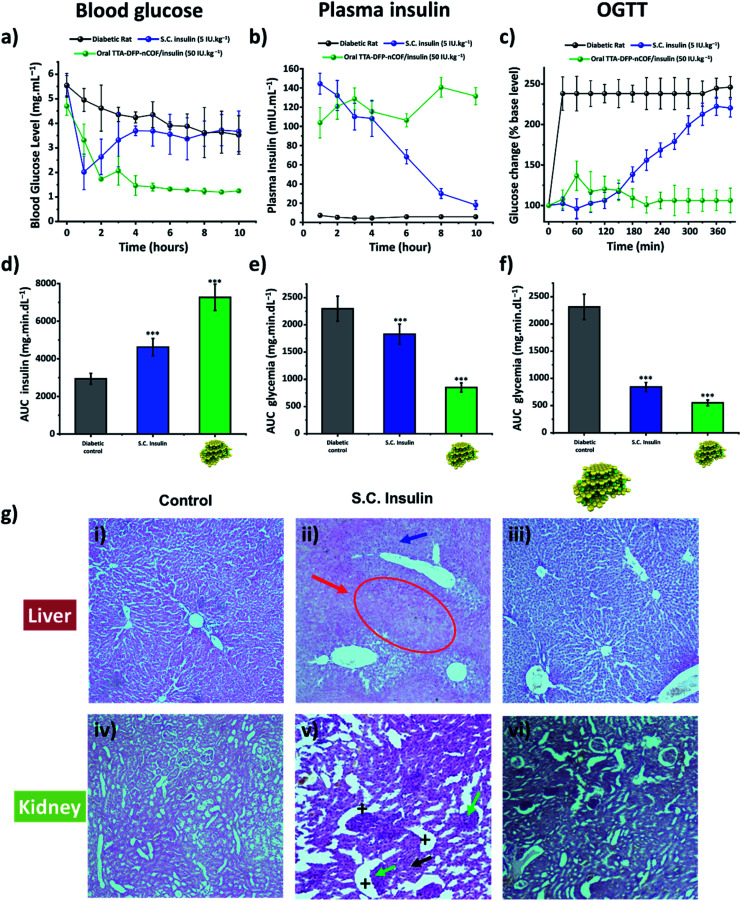
Fig. 3. TTA-DFP-nCOF/insulin regulates glucose uptake in vivo without causing toxicity. (a) Blood glucose level evolution, (b) serum insulin level changes and (c) oral glucose tolerance test (OGTT) results of the STZ-induced diabetic rats over time after oral administration of TTA-DFP-nCOF/insulin (green) at an insulin dosage of 50 IU kg−1. The group with subcutaneous injection (S.C., blue) of insulin at 5 IU kg−1 was set as the positive control. Glycemic level, plasma insulin level and OGTT results of the diabetic rats (control) are illustrated in black. The corresponding area under the curve (AUC) is depicted in (d)–(f) for glycemic levels, plasma insulin levels and OGTT results, respectively. TTA-DFP-nCOF/insulin showed statistically significant differences in glycemic levels, plasma insulin levels and OGTT results compared with S.C. insulin solution and diabetic control (* p <0.05; ** p <0.01; *** p <0.001). Each value represents mean ± S.D. (n = 3). (g) Histopathological study. Sections of liver (i–iii) and kidney (iv–vi) of diabetic control rats (i and iv), S.C. insulin-injected rats (5 IU kg−1, (ii) and (v) and diabetic rats treated orally with TTA-DFP-nCOF/insulin (50 IU kg−1, (iii) and (vi) In figure (ii), the white arrow points to big hepatocytes, and the red arrow highlights necrosis of hepatocytes and a narrowing of the sinusoids. In figure (v), the + signs indicate Bowman capsules while the green arrow points to glomeruli hypertrophy, and tubule necrosis is indicated by the black arrow.

Fig. 3