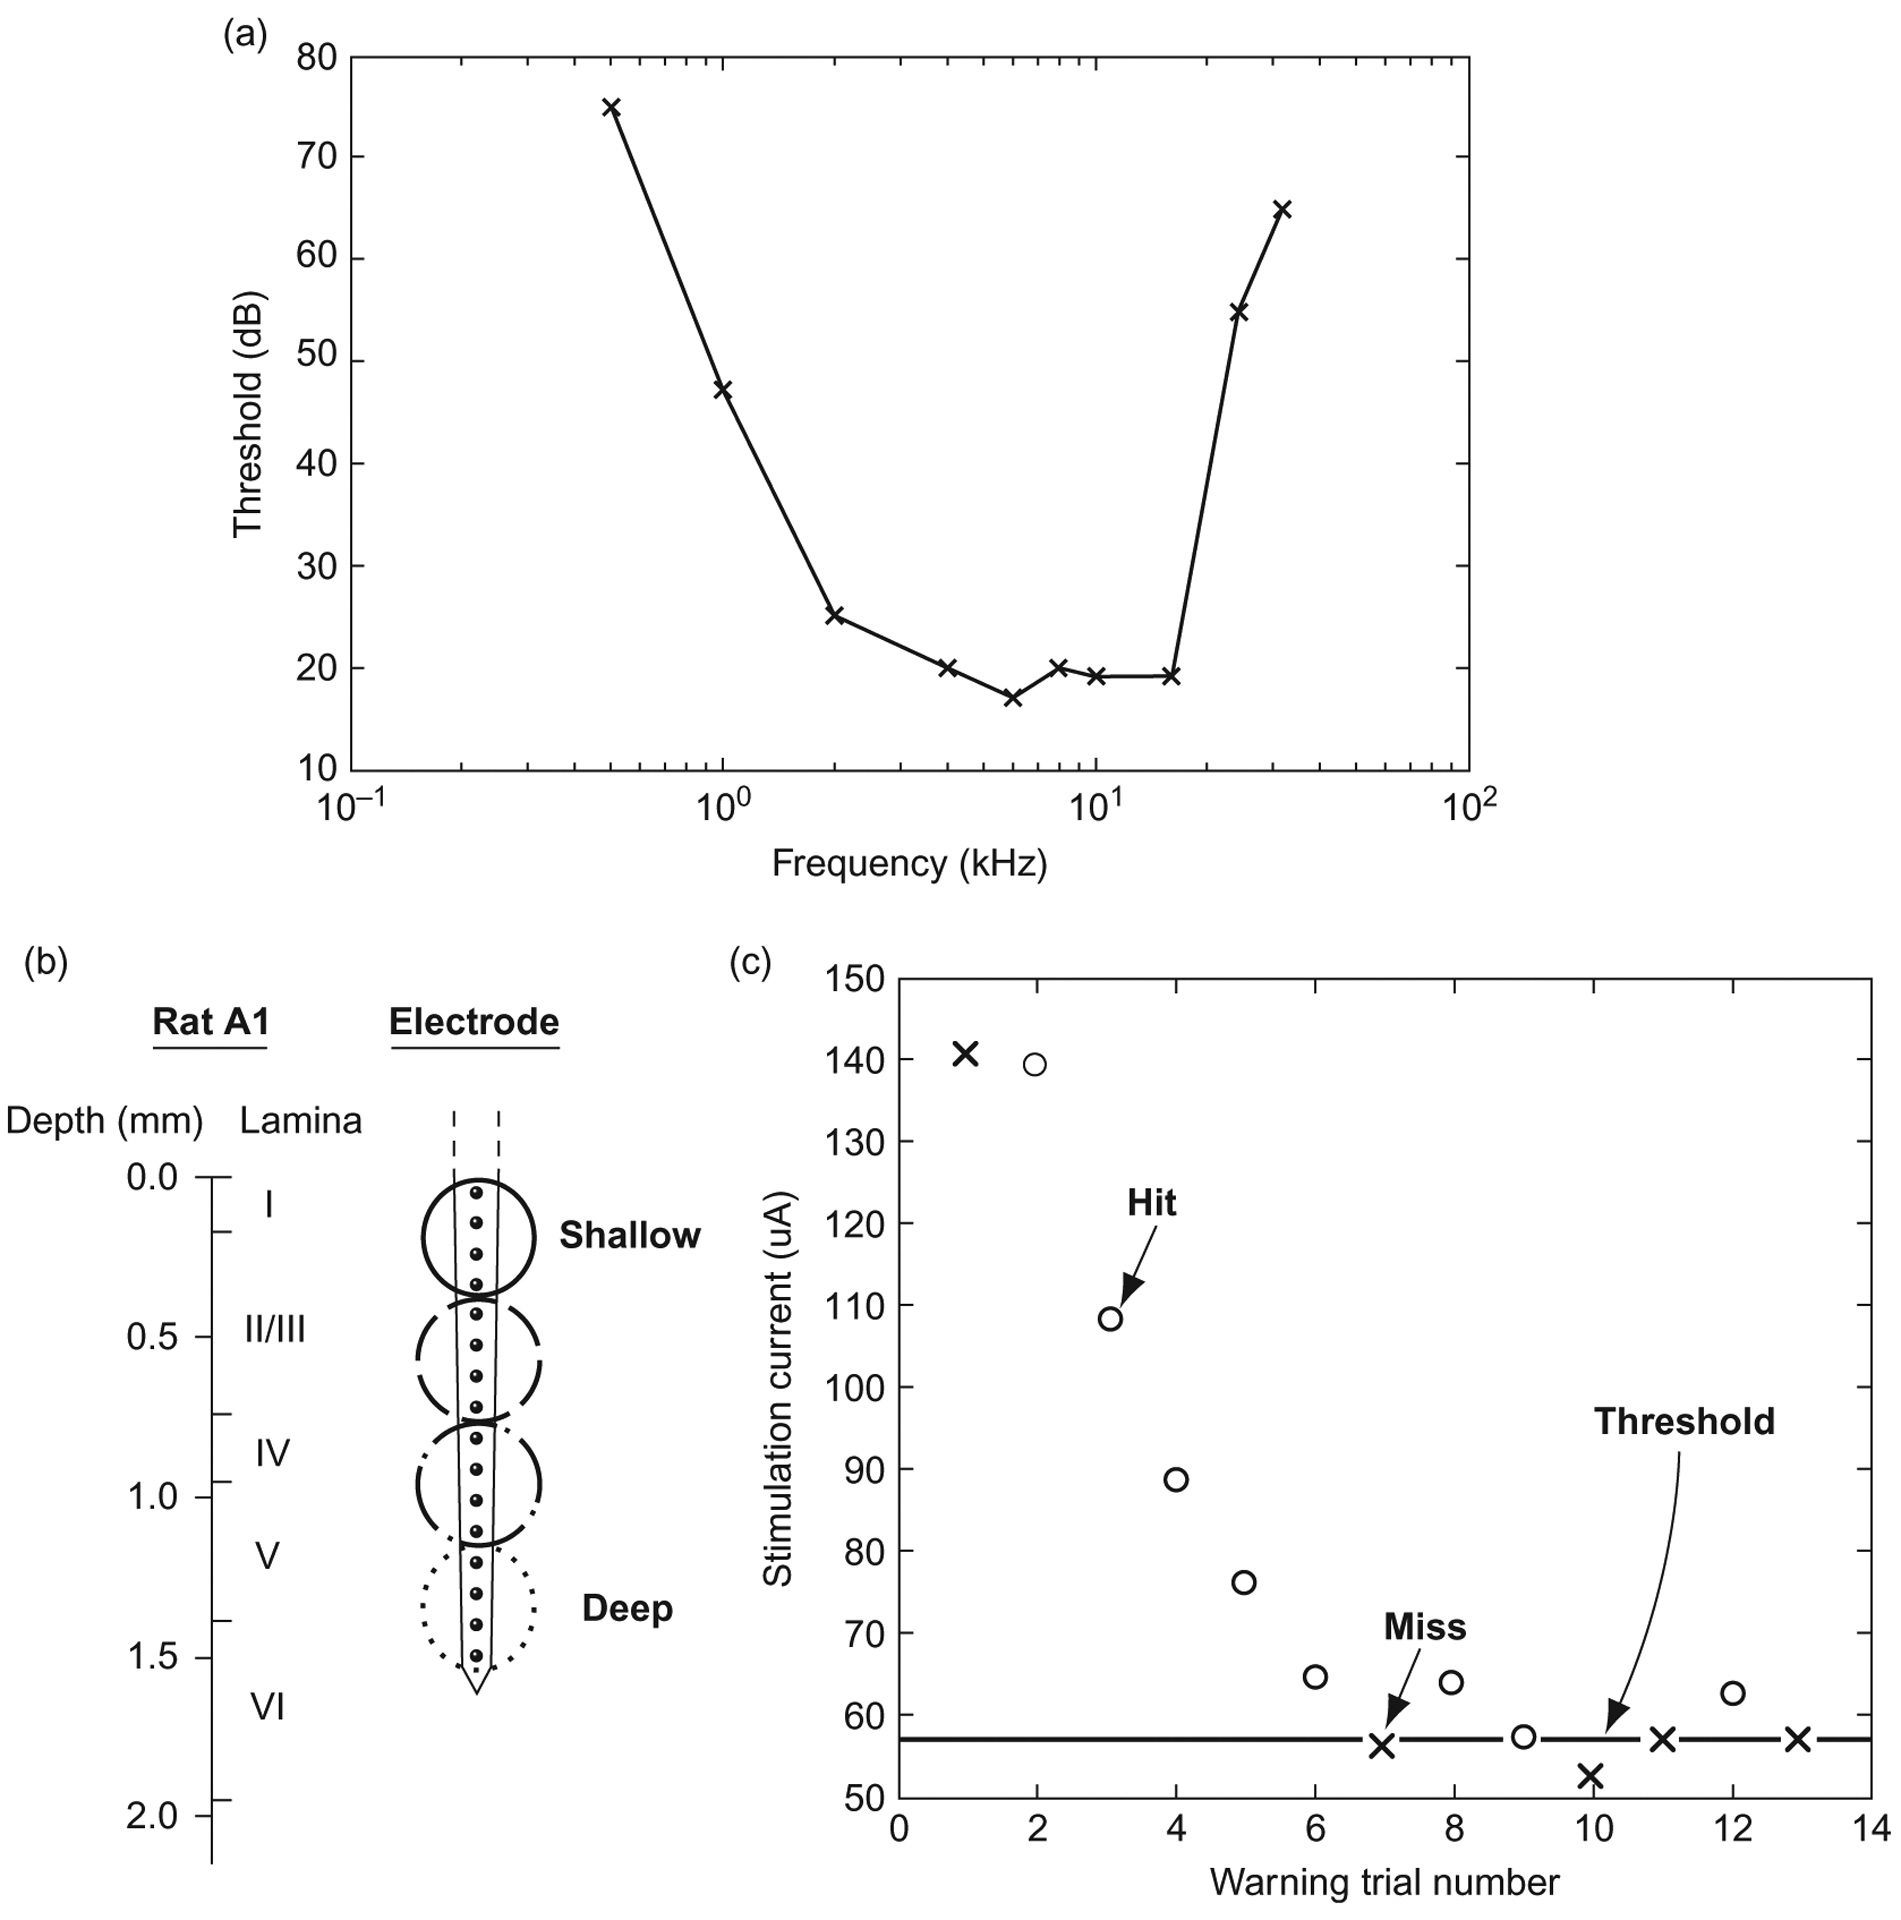
Fig. 1.

Experimental background. (a) Sample audiogram generated by a rat in a single day. (b) Schematic representation of rat auditory cortex delineating histological layers as well as relative electrode site placement. (c) Sample rat adaptive threshold task: “○” represents a hit, “×” represents a miss, the bold line represents the threshold estimate.
