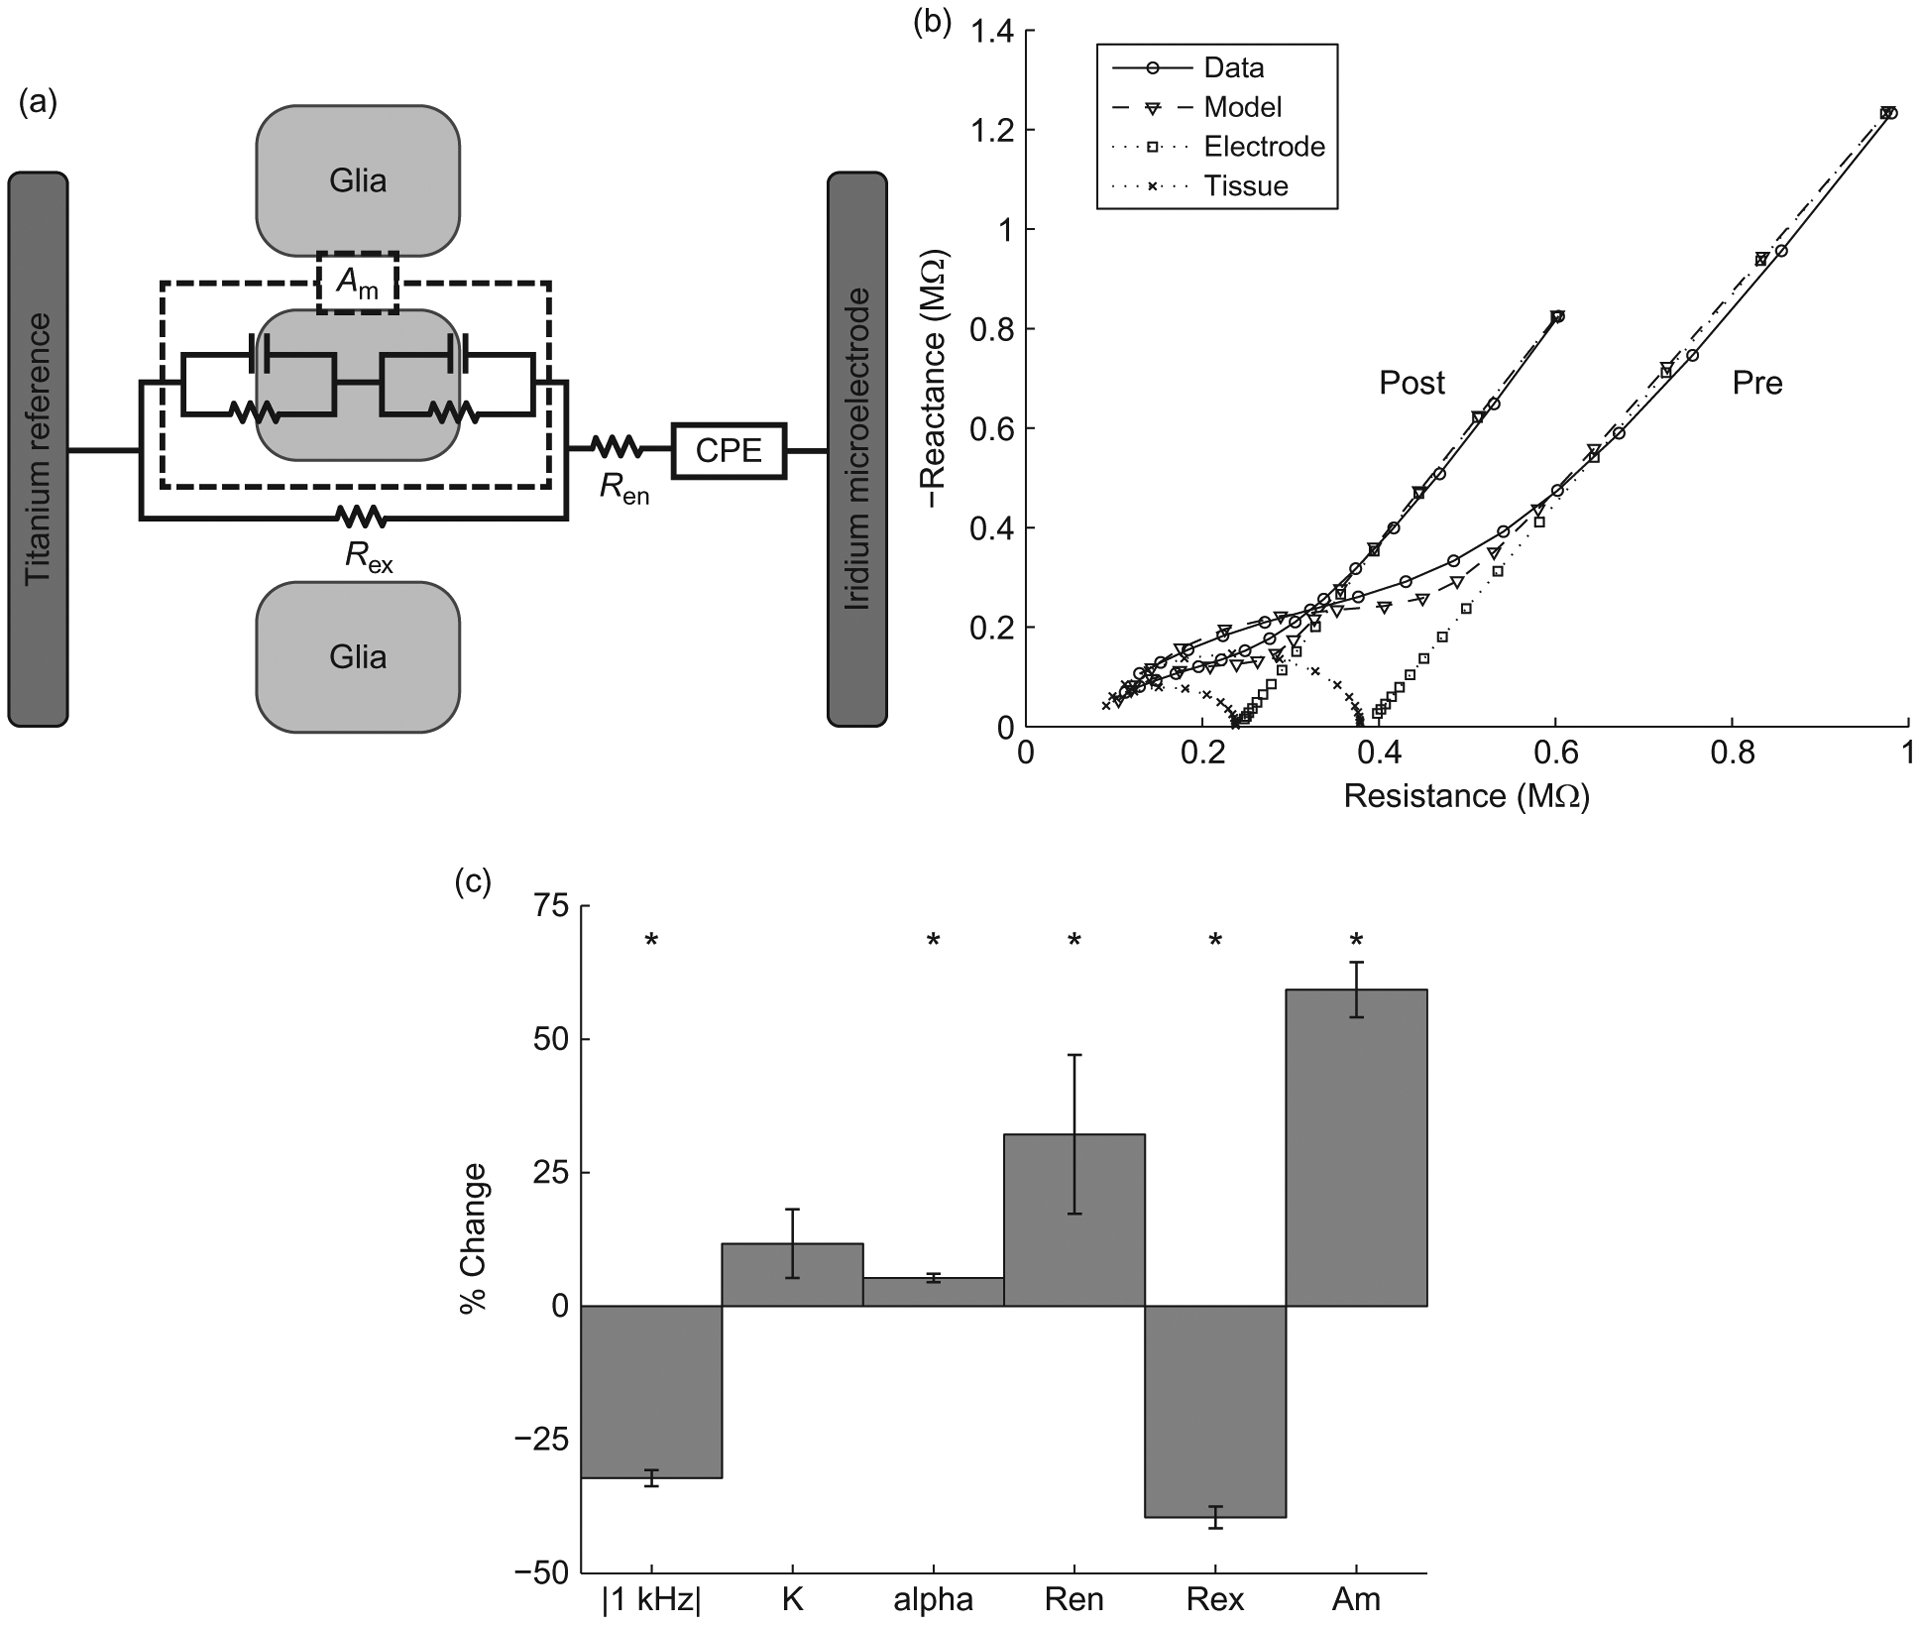
Fig. 6.

Modeling effects of stimulation on electrode impedance. (a) Equivalent circuit model of the electrode–tissue interface.(b) Nyquist plots of measured and modeled impedance spectra from an electrode pre- and postmicrostimulation. (c) Significant changes in 1 kHz impedance and model parameters occur pre- and postmicrostimulation, especially for the tissue components Ren, Rex, and Am (n=350, paired t-test, p<0.01).
