Figure 2.
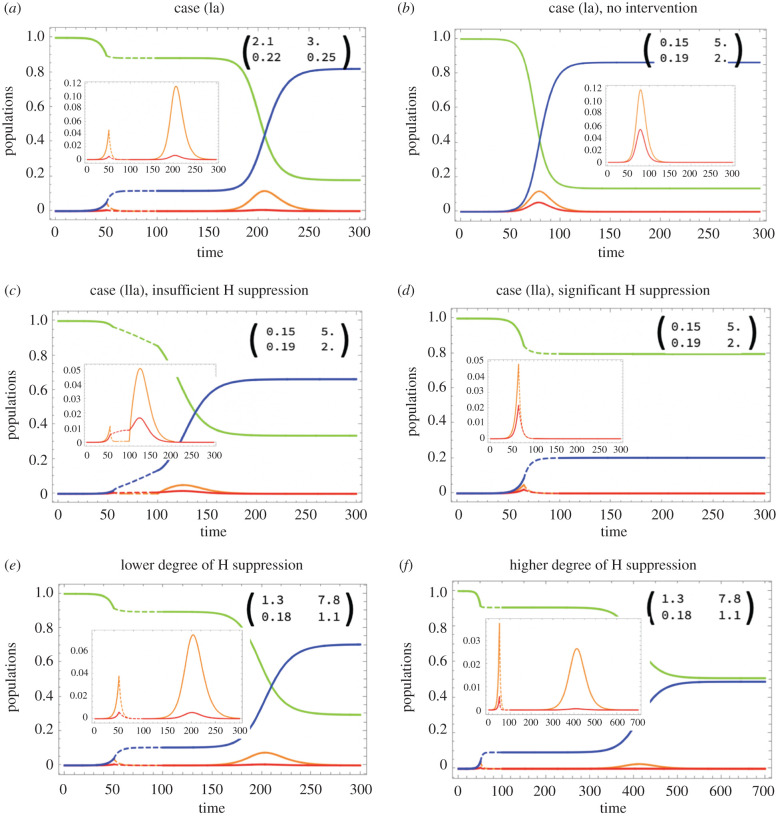
Simulated epidemic dynamics in different cases. Four populations are shown as functions of time: susceptible (green), mildly SARS-CoV-2 infected (orange), severely COVID-19 infected (red) and recovered/dead (blue). Insets show detail in the dynamics of infected, and the matrix elements Aij. Intervention is shown by dashed lines. It is assumed that during intervention, both H and C channels are suppressed, and afterwards channel C is restored to its full capacity. (a) Case (Ia) (see text), where the spread of infection is mostly through mildly infected who comprise the majority; opening up leads to a second wave of infection. (b–d) Case (IIa), where the spread of infection is mostly through severely infected although the majority are still mildly infected. In (b), no intervention is implemented; the effects of social distancing are shown in (c) (insufficient H suppression, a second wave is predicted) and (d) (significant H suppression, no second wave). (e,f) Both C and H channels contribute about equally to infection spread; opening up the C channel results in a second wave, but a higher degree of H suppression leads to a smaller and more delayed second wave. In all simulations, R0 = 2.4. Other parameters are given in electronic supplementary material, tables S1–S3. Time-series of the effective reproductive number, Reff, are shown in electronic supplementary material, figure S3.

