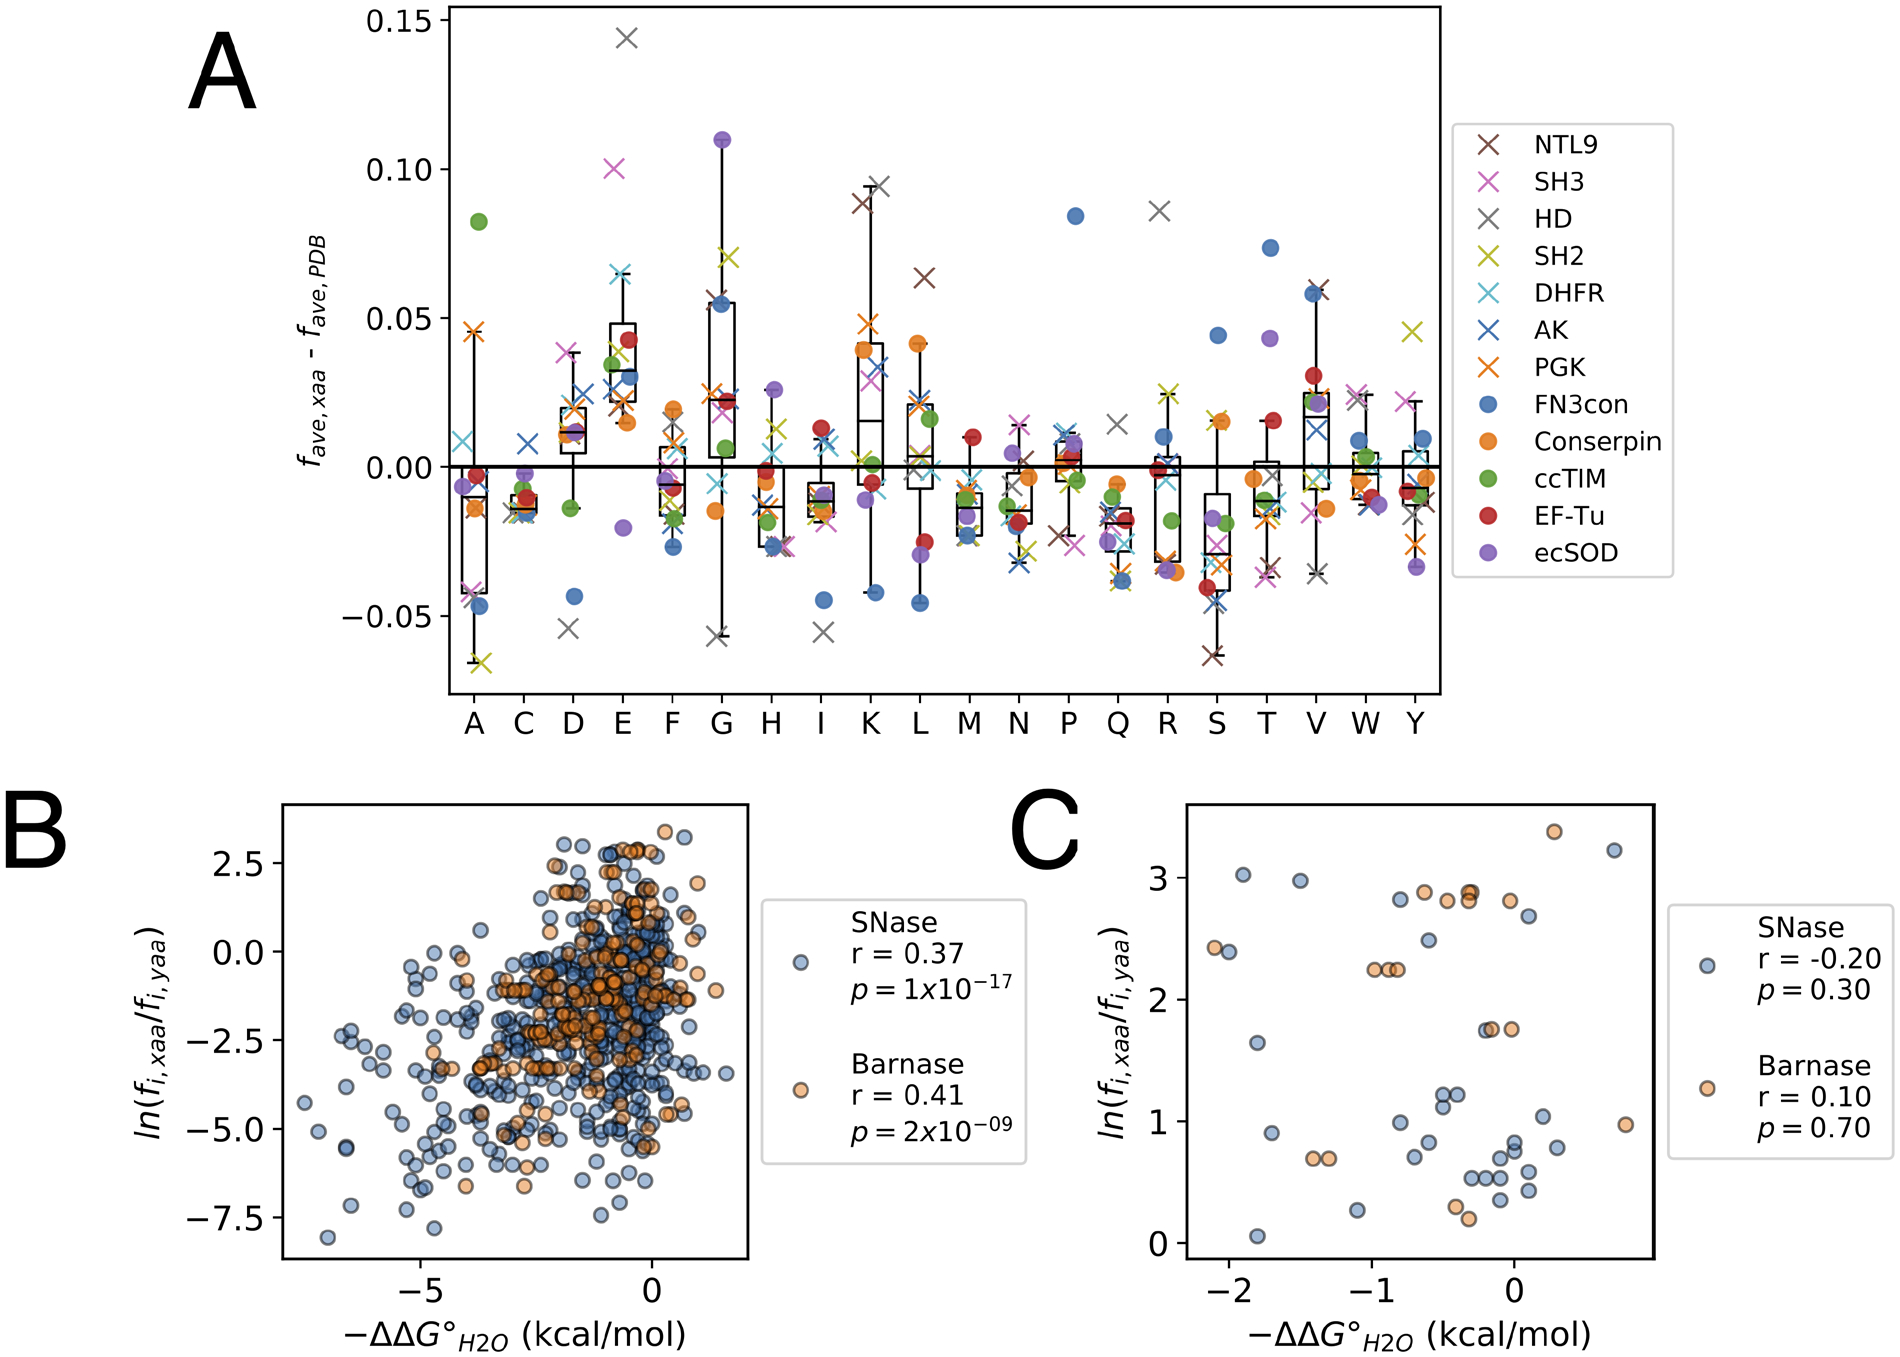
Figure 4. Features of consensus sequences.

(A) Average residue frequencies in consensus compared to extant sequences. Each marker represents the difference in the average frequency of a residue in a consensus sequence from the literature (favg, xaa; obtained by dividing the number of residues of a given type by the consensus sequence length L) and the average residue frequency of the same residue among sequences obtained from a nonredundant set from the PDB (favg, PDB). X’s indicate sequences designed by our lab, circles indicate sequences designed in other labs (Table S1). The analysis above is limited to consensus sequences designed from MSAs with more than 100 sequences. The box indicates the interquartile range (IQR), the line within the box indicates the median, and the whiskers extend to the last data point within +/− 1.5*IQR. (B) and (C) Correlations between folding free energy changes (ΔΔG°H2O) from the Protherm database and the Boltzmann-like energies for point substitutions determined from the residue frequencies in MSAs in SNase (blue, n = 514 substitutions) and Barnase (orange, n = 200 substitutions). Pearson correlation coefficients (r) and p values (p) for the correlation coefficients are shown for each distribution. Panel (B) shows all substitutions; panel (C) shows only the subset of the substitutions to consensus residues from panel B.
