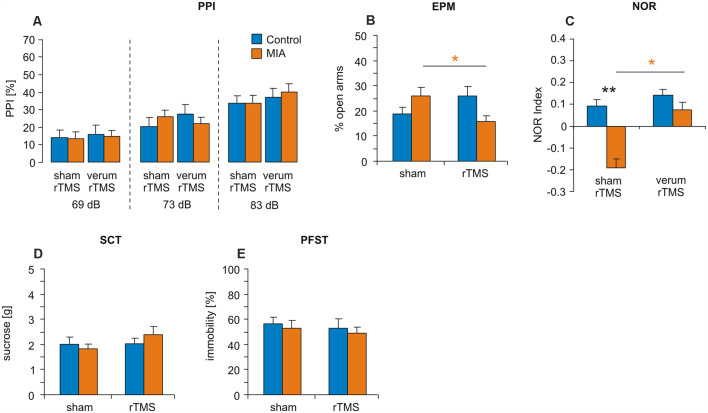
Figure 3.
iTBS applied to juvenile rats: effects on PPI, EPM, NOR, SCT and PFST. MIA and control rats were tested at adulthood for (A) PPI, (B) EPM, (C) NOR, (D) SCT and (E) PFST after iTBS-rTMS (sham or verum) had been applied during adolescence. Colored asterisks: t-test comparing sham and verum-iTBS groups (controls: blue, MIA: orange), black asterisks: t-test comparing MIA and control groups. *p < 0.05, **p < 0.01. Data are shown as group means ± SEM. N = 12 control-sham, N = 12 control-verum, N = 13 MIA-sham, N = 14 MIA-verum.

