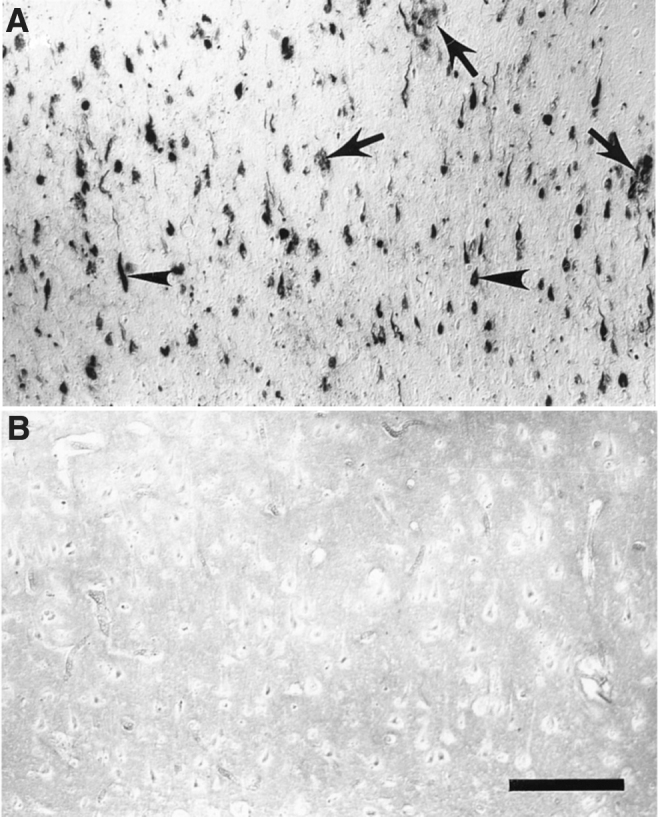
FIG. 4.

Histochemical location of redox-active iron in AD tissue sections. (A) Tissue section from AD brain. (B) Control. Arrowheads indicate neurofibrillary tangle and arrows indicate amyloid senile plaques. Scale bar = 200 μm. From Smith et al. (162).
