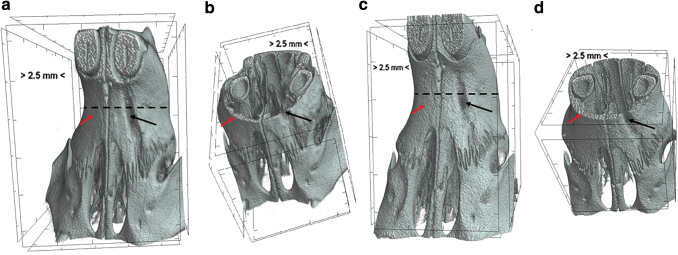
FIG. 2.
Microcomputed images (micro-CT) data showing defect group. (a) 4 weeks postsurgery; (b) axial section of the rat head showing defect at week 4 (c) 8 weeks after surgery; (d) axial section showing rat head showing defect at one side and no defect (no surgical intervention) at other side. There was no spontaneous bone regeneration in the defect area at either 4 or 8 weeks. The red arrow represents no defect (no surgical intervention) area and black arrow represents surgically made defect. Broken black line indicates the axial section that was represented in (b, d). micro-CT, microcomputed tomography. Color images are available online.

