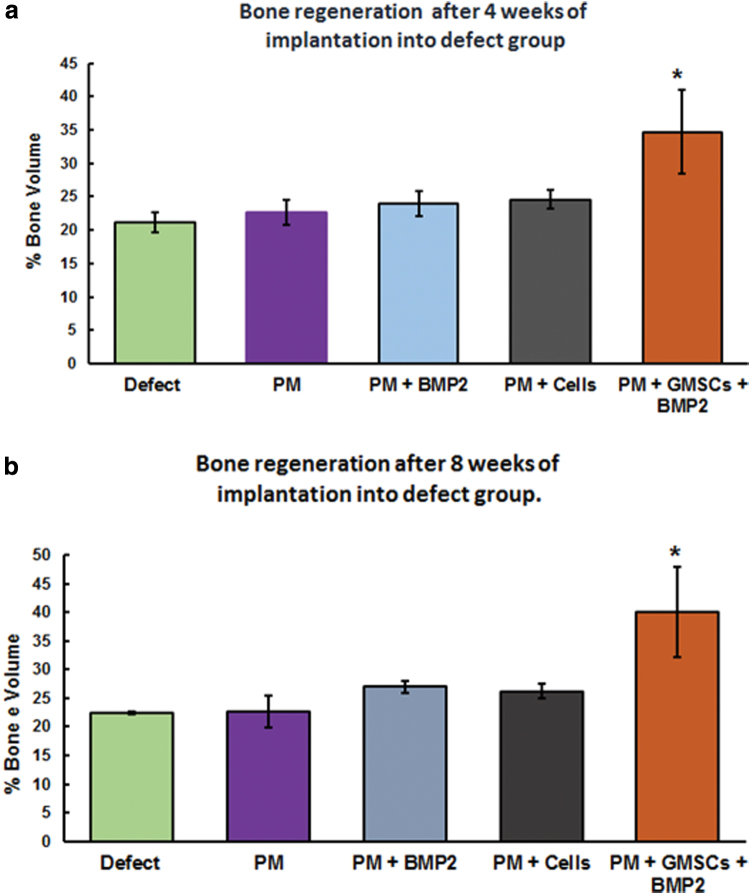
FIG. 4.
Quantitative analysis of micro-CT data showing % bone volume at week 4 and 8 postsurgery. X-axis represents the groups and Y-axis indicates the % bone volume. The results were expressed as % bone volume. Control defect group was compared with experimental groups. The bone regenerated in all experimental groups, however, there was no significant difference between control and PM group, PM + dGMSCs, or PM + BMP2 either at 4 or 8 weeks. There was significant increase in the bone volume in PM + dGMSCs + BMP2 group at 4 and 8 weeks compared with control and all other groups (p < 0.0001). (a) 4 weeks, (b) 8 weeks. Error bars represent standard deviation. *Depicts statistical difference between control defect group and PM/BMP2/dGMSCs. Color images are available online.

