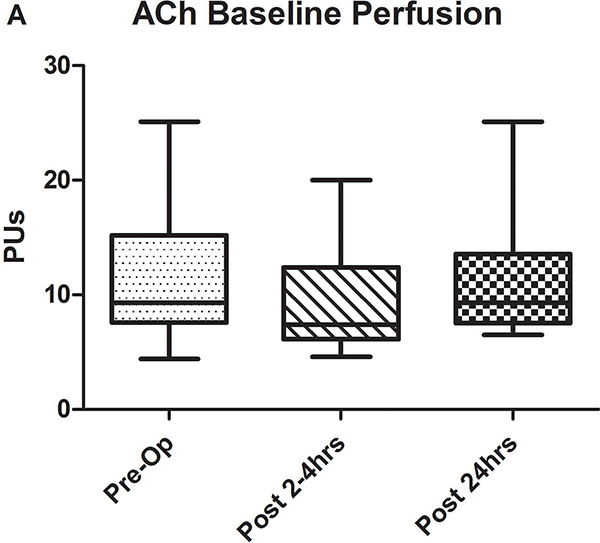
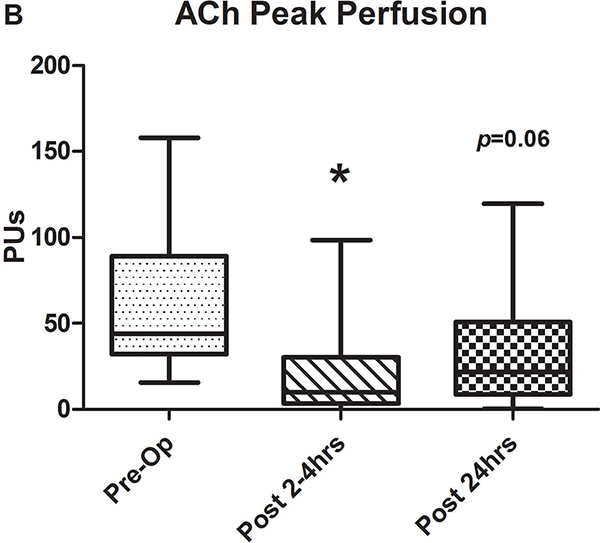
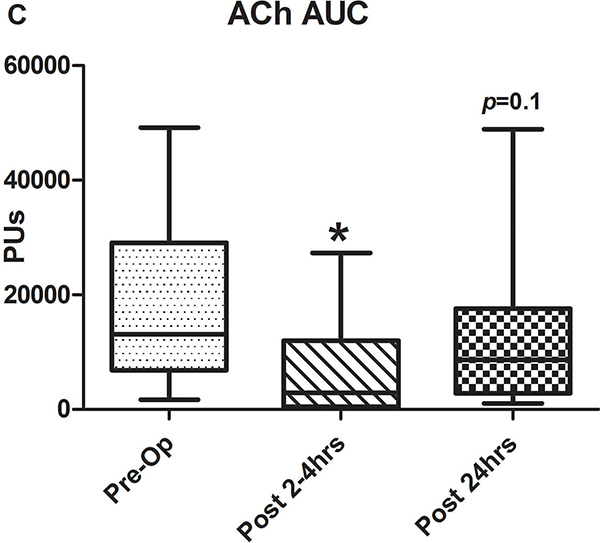
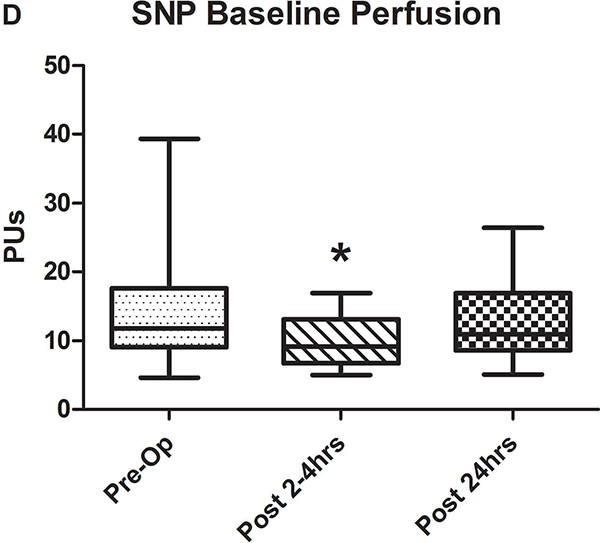
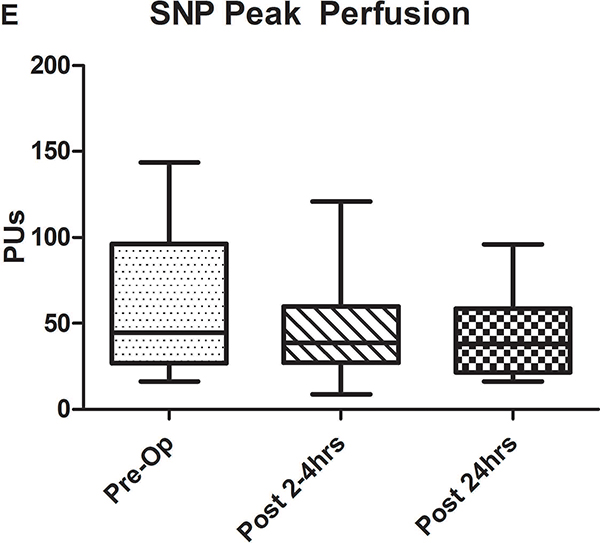
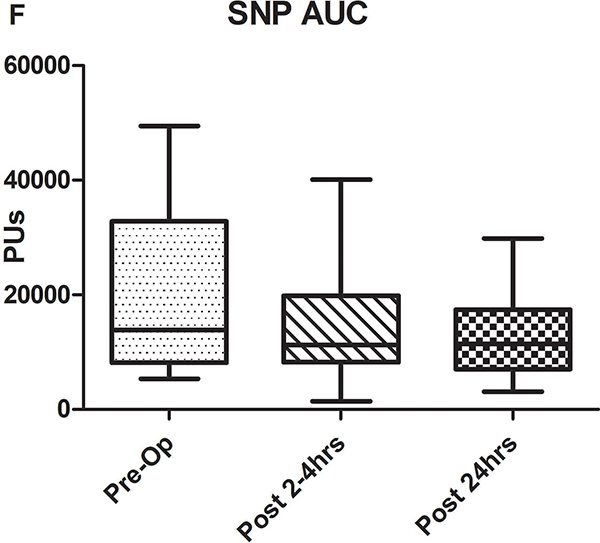
Figure 2.
A-C) Results for ACh iontophoresis, comparing pre-operative values with post-CPB values. D-F) Results for nitroprusside (SNP) iontophoresis. All data are expressed in perfusion units (PUs). AUC=area under the curve for 10 minute measurement period after being zeroed to baseline values. Lines within shaded area represent medians, edges of shaded area represent 1st and 3rd quartiles, and whiskers represent maximum and minimum values. Wilcoxon Rank Sum used to compare post-op values to pre-op values. * Indicates p<0.05.

