FIGURE 1:
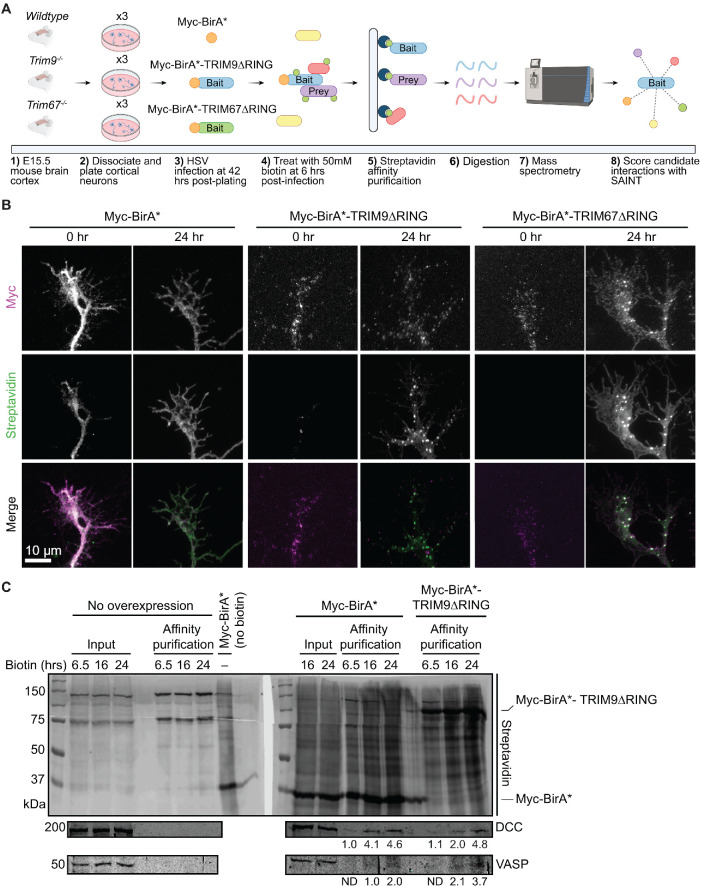
BioID approach to identify candidate interaction partners of TRIM9 and TRIM67 in embryonic cortical neurons. (A) Graphical representation of the BioID approach. E15.5 cortical neurons were transduced with HSV carrying Myc-BirA*, Myc-BirA*TRIM9∆RING, or Myc-BirA*TRIM67∆RING, and media was supplemented with 50 μM biotin. Following cell lysis, biotinylated proteins were affinity purified, and enriched proteins were subjected to on-bead trypsinization. Candidate peptides were identified by mass spectrometry. (B) Images of axonal growth cones from control Myc-BirA*, Myc-BirA*-TRIM9∆RING, Myc-BirA*-TRIM67∆RING expressing neurons at 0 and 24 h post–biotin addition, stained with fluorescent streptavidin and anti-Myc antibody. Merged images show colocalized streptavidin and Myc signals. (C) Western blots of streptavidin affinity purification of biotinylated proteins from cortical neurons expressing Myc-BirA* or Myc-BirA*-TRIM9∆RING. Samples include inputs and affinity-purified samples from controls that do not express BirA* (6.5, 16, 24 h), input from neurons expressing Myc-BirA* but not supplemented with biotin, inputs (16, 24 h) and affinity-purified samples (6.5, 16, 24 h) from neurons expressing Myc-BirA* and supplemented with biotin, and affinity-purified samples from neurons expressing Myc-BirA*-TRIM9∆RING (6.5, 16, 24 h) and supplemented with biotin. Blots were probed for streptavidin, DCC, and VASP. Numbers below the anti-DCC blot represent DCC intensity values normalized to the intensity of the DCC band enriched in the affinity-purified samples (6.5 h) from neurons expressing Myc-BirA*. Numbers below the anti-VASP blot represent VASP intensity values normalized to the intensity of the VASP band enriched in the affinity-purified samples (16 h) from neurons expressing Myc-BirA*. VASP was not detected (N.D.) in affinity-purified samples (6.5 h) from neurons expressing Myc-BirA* or Myc-BirA*-TRIM9∆RING.

