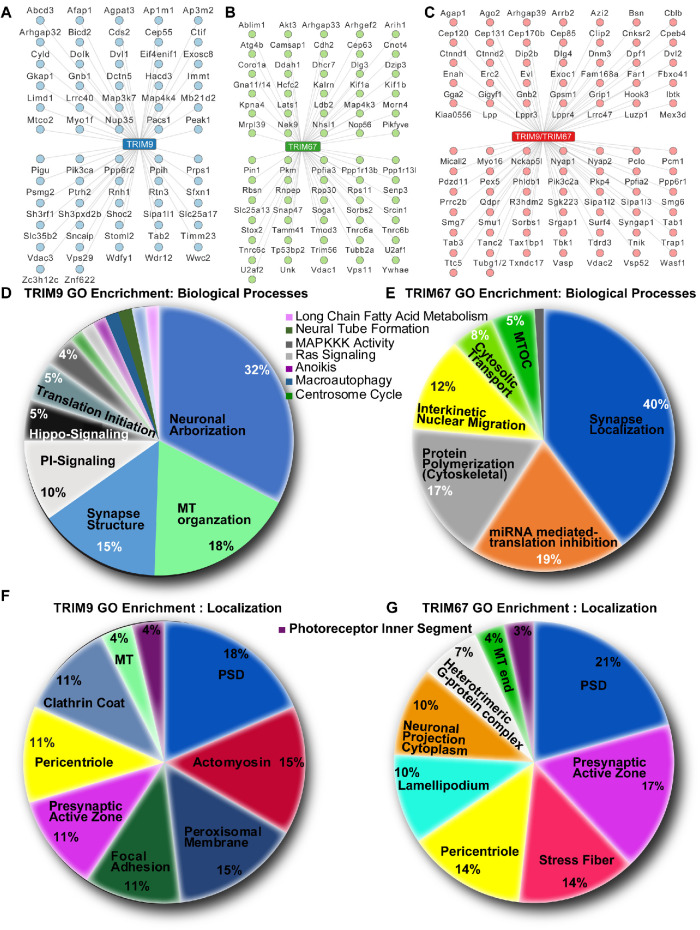
FIGURE 2:
Candidate TRIM9 and TRIM67 interaction partners. (A–C) Potential high-confidence (FDR ≤ 0.259) interaction partners unique to TRIM9 (A), unique to TRIM67 (B), or shared (C). (D, E) Pie charts of biological processes enriched via GO classification of high-confidence TRIM9 and TRIM67 interaction partners, respectively. (F, G) Pie charts of cellular localization terms enriched via GO classification of high-confidence TRIM9 and TRIM67 interaction partners, respectively. Percentages for a particular GO term in D–G represent the number of gene IDs that hit against the total number of gene IDs annotated.

