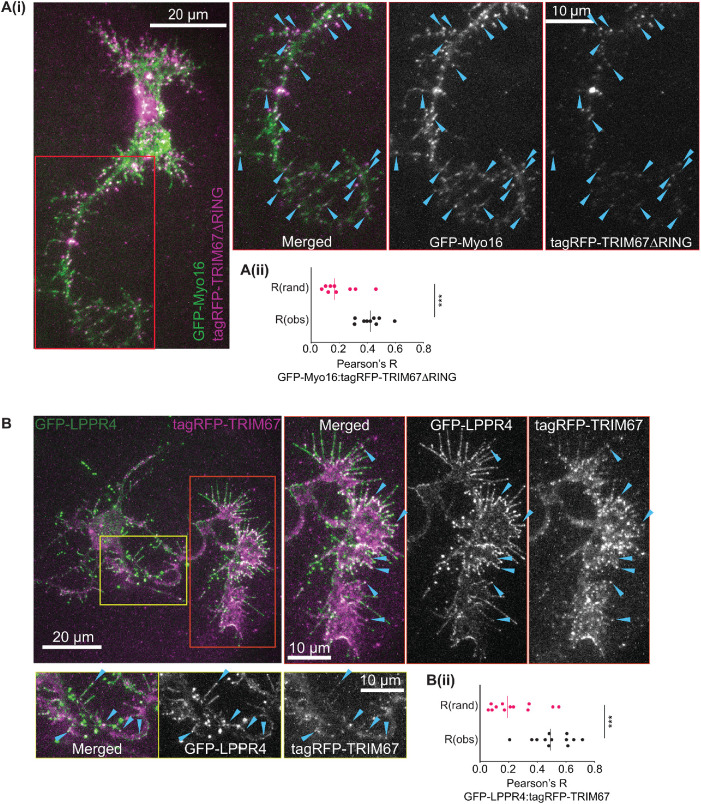
FIGURE 4:
Myo16 and LPPR4 colocalize with TRIM67. (Ai) Representative images to demonstrate colocalization of GFP-Myo16 with tagRFP-TRIM67∆RING. Zoomed inset and the blue arrowheads show colocalization along the axon and in filopodia along the axon. (Aii) Pearson’s correlation of colocalization between GFP-Myo16 and tagRFP-TRIM67∆RING (Robs) compared with Fay-randomized controls (Rrand). (n = 9 cells from three biological replicates.) (Bi) Representative images to demonstrate colocalization of GFP-LPPR4 with tagRFP-TRIM67. Zoomed inset and the blue arrowheads show colocalization along the axon (yellow box) and at the axonal growth cone (red box). (Bii) Pearson’s correlation of colocalization between GFP-LPPR4 and tagRFP-TRIM67 (Robs) compared with Fay-randomized controls (Rrand). (n = 12 cells from four biological replicates.) Datapoints were compared using Student’s t test, ***, P < 0.005.

