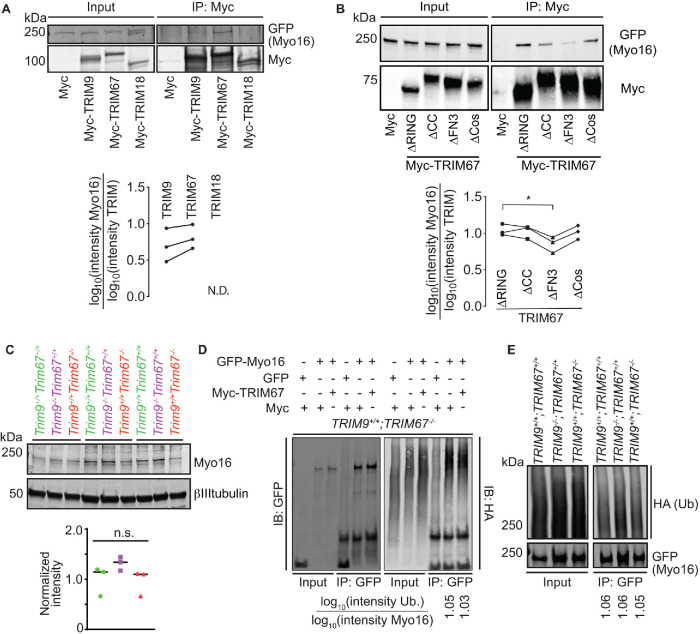
FIGURE 5:
Myo16 interacts specifically with TRIM9 and TRIM67. (A) Immunoblot demonstrating GFP-Myo16 co-IP specifically with class I TRIM proteins, TRIM9 and TRIM67, but not TRIM18 (TRIM proteins used in this assay are full-length and Myc-tagged) (n = 3). Plot with individual datapoints of co-IP GFP-Myo16 relative to Myc-TRIM9 or Myc-TRIM67. GFP-Myo16 did not coprecipitate with Myc-TRIM18 (N.D.). (B) Representative immunoblot of TRIM67 domain deletion constructs (TRIM67∆RING, TRIM67∆CC, TRIM67∆FN3, TRIM67∆SPRY) IP demonstrating that the FN3 domain of TRIM67 is necessary for GFP-Myo16 and Myc-TRIM67 interaction (n = 3). Plot with individual datapoints of co-IPGFP-Myo16 relative to TRIM67 domain deletion constructs (∆RING, ∆CC, ∆FN3, ∆SPRY). (C) Immunoblot showing that endogenous Myo16 protein levels were not significantly different in cultured embryonic cortical neurons from wild type (Trim9+/+:Trim67+/+), Trim9–/–:Trim67+/+, Trim9+/+:Trim67–/– at 2 DIV. Quantification from three biological replicates. (D) Representative immunoblot demonstrating GFP (control) and GFP-Myo16 ubiquitination levels in TRIM67–/–HEK cells expressing either Myc or Myc-TRIM67. The blot was probed with anti-GFP and anti-HA antibodies to visualize Myo16 and ubiquitin, respectively. Myo16 ubiquitination status is not altered (n = 3). Ratio of log transformed intensities of HA-ubiquitin relative to immunoprecipitated GFP-Myo16 denoted below respective lanes. (E) Representative immunoblot demonstrating GFP-Myo16 ubiquitination levels in wild-type, TRIM9–/–;TRIM67+/+, TRIM9+/+;TRIM67–/–HEK cells. The blot was probed with anti-GFP and anti-HA antibodies to visualize Myo16 and ubiquitin, respectively. Myo16 ubiquitination status is not altered (n = 3). Ratio of log transformed intensities of HA-ubiquitin relative to immunoprecipitated GFP-Myo16 denoted below the respective lanes. Datapoints in A and B were analyzed using nonparametric analysis of variance (ANOVA) with Fisher’s Least Significant Difference (LSD) post-hoc correction, *, P < 0.05. Nonsignificant differences are not represented. Datapoints in C were analyzed using nonparametric ANOVA followed by the Benjamini–Hochberg procedure. Nonsignificant differences are not represented.

