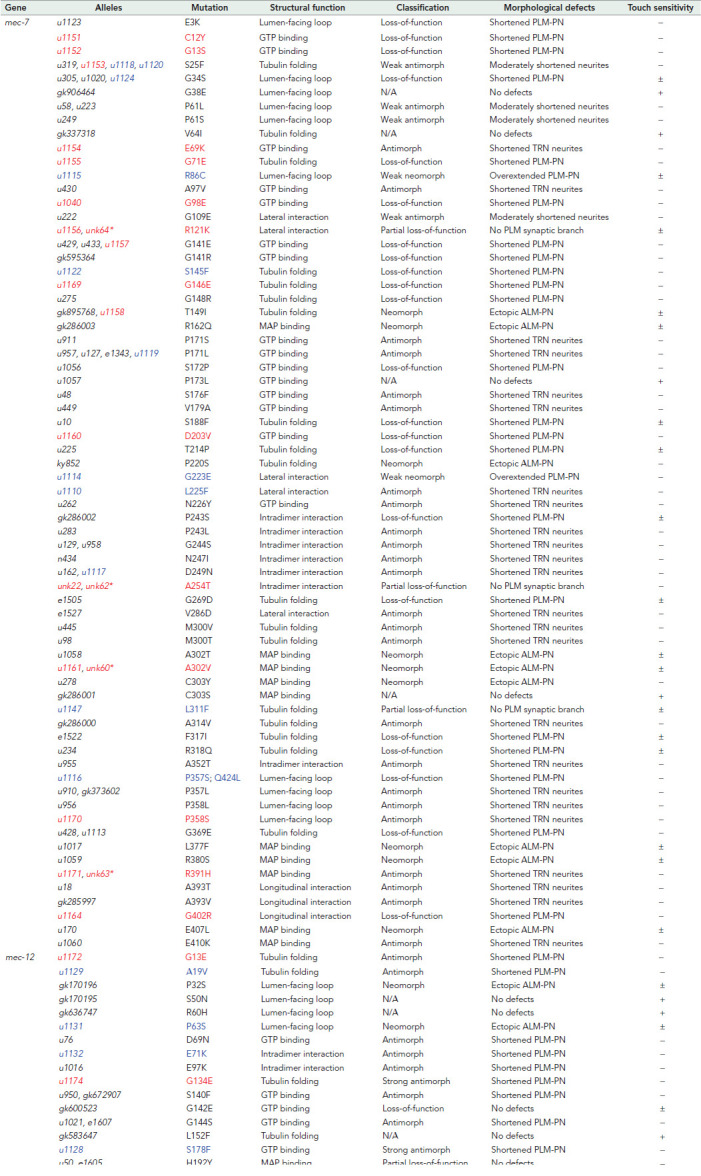
TABLE 1:
The mec-7 and mec-12 mutations analyzed for the effects on TRN neurite growth.
 |
Alleles in black were previously analyzed (Zheng et al., 2017); alleles in red were isolated from the mec-7(u278 neo) suppressor screen; alleles in blue were isolated from the mec-17(-) suppressor screen. For touch sensitivity, (+) indicates the average response to five anterior stimuli is above 4; (±) indicates the average is between 4 and 1; (−) indicates the average is below 1. Asterisks indicate the alleles created through CRISPR/Cas9-mediated genome editing. Amino acid residues affected by the missense mutations were mapped to the B. taurus α/β-tubulin structures (Nogales et al., 1998).
