FIGURE 6:
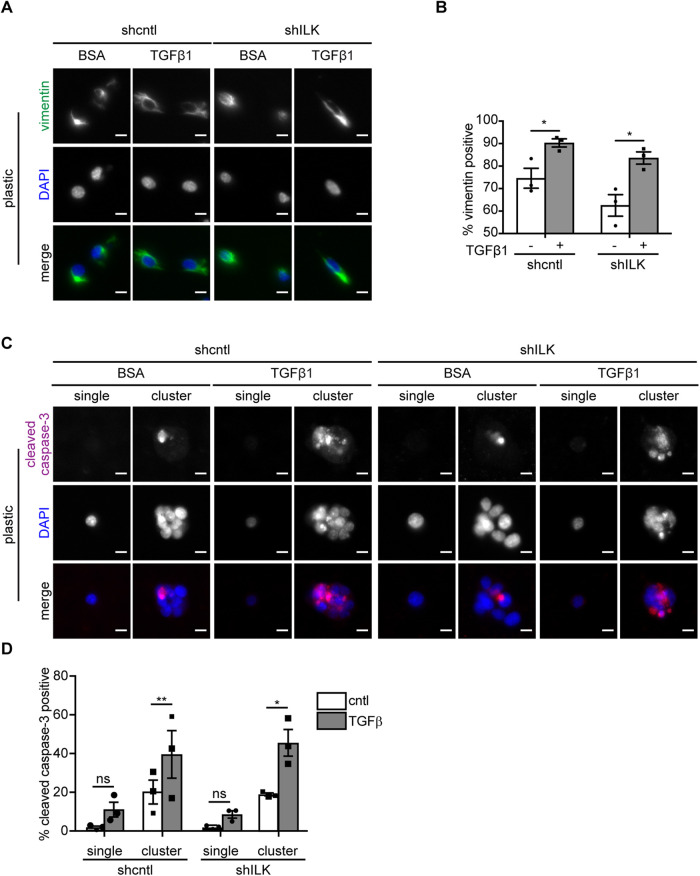
Low cell–cell adhesion promotes TGFβ1-induced EMT. (A) Immunofluorescence analysis for vimentin (green) and nuclei (blue) in shcntl and shILK cells on micropatterns treated with or without TGFβ1 for 24 h. Scale bars, 10 μm. (B) Quantification of the percentage of vimentin-positive single shcntl and shILK cells cultured on micropatterned substrata treated with or without TGFβ1 for 24 h. (C) Immunofluorescence analysis for cleaved caspase-3 (magenta) and nuclei (blue) in shcntl and shILK cells on micropatterns treated with or without TGFβ1 for 24 h. Scale bars, 10 μm. (D) Quantification of the percentage of cleaved caspase-3-positive shcntl and shILK cells cultured individually or as clusters on micropatterned substrata and treated with or without TGFβ1 for 24 h. Error bars represent SEM of three independent replicates; each replicate contains at least 200 cells per condition. *P < 0.05; **P < 0.01.

