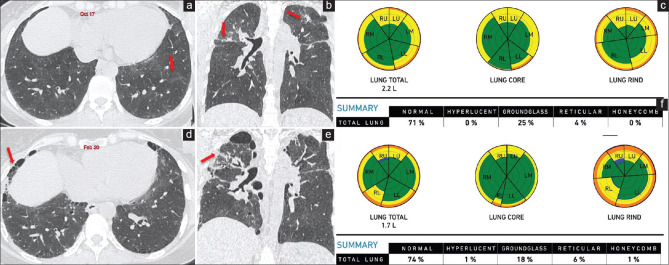
Figure 6.
(a-f) Chronic hypersensitivity pneumonitis. Computed tomography images show ground glass (arrows in a) with bronchocentric fibrosis (arrows in b) in October 2017. The retrospective Computer-Aided Lung Informatics for Pathology Evaluation and Rating analysis (c) shows 29% lung involvement with ground glass of 25% and fibrosis of 4% and pulmonary vessel-related structure score of 3.46%. In February 2020, computed tomography images show progression of fibrosis with honeycombing (arrows in d) and upper lobe predominance (arrows in e). Computer-aided lung informatics for pathology evaluation and rating (f) shows lung volumes reduced from 2.2 L to 1.7 L with progression of fibrosis to 6% and reduction in ground glass to 18%. The total fibrosis has increased by 75%. The pulmonary vessel-related structure score is 4.85% showing 40% progression

