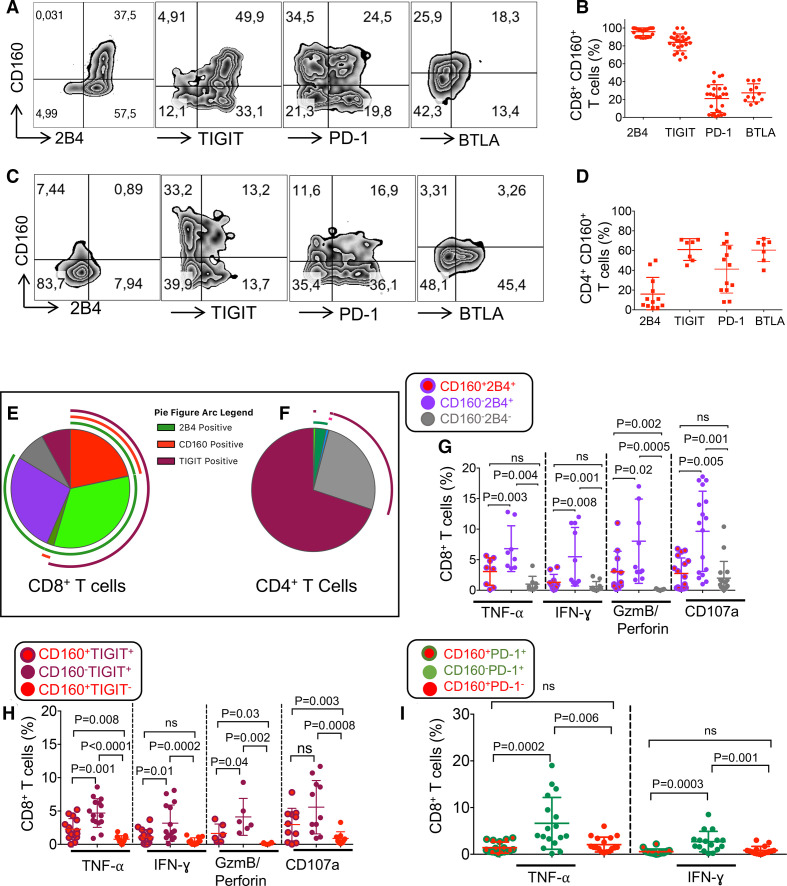
Figure 4.
Co-expression of CD160 with other co-inhibitory receptors on T cells in patients with lymphocytic leukemia (CLL). (A) Representative flow cytometry plots, and (B) cumulative data showing percentages of CD160 co-expression with 2B4, TIGIT, PD-1, and BTLA in CD8+ T cells. (C) Representative flow cytometry plots, and (D) cumulative data showing percentages of CD160 co-expression with 2B4, TIGIT, PD-1, and BTLA in CD4+ T cells. (E) The pie chart showing percentages of CD8+ T cells co-expressing CD160, 2B4, and TIGIT, simultaneously. (F) The pie chart showing percentages of CD4+ T cells co-expressing CD160, 2B4, and TIGIT, simultaneously. (G) Cumulative data showing percentages of tumor necrosis factor-α (TNF-α), interferon-γ (IFN-γ), granzyme-B (GzmB), perforin and CD107a expressing cells among CD160+2B4+/CD160-2B4+/CD160-2B4- CD8+ T cells. (H) Cumulative data showing percentages of TNF-α, IFN-γ, GzmB, perforin and CD107a expressing cells among CD160+TIGIT+/CD160-TIGIT+/CD160+TIGIT- CD8+ T cells. (I) Cumulative data showing percentages of TNF-α, IFN-γ expressing cells among CD160+PD-1+/CD160-PD-1+/CD160+PD-1- CD8+ T cells. Each dot represents data from a single patient with CLL. BTLA, B- and T-lymphocyte attenuator; PD-1, programmed cell death protein-1; TIGIT, T cell immunoreceptor with Ig and ITIM domains.

